如今,部署一个三层(表示层、业务逻辑和存储)架构应用程序可能会有些棘手。假设我们有一个简单的 Django 应用程序,即本教程中的民意投票应用程序。它在我们的本地计算机上运行完美,我们添加了requirements.txt 来保存该项目的依赖项。至于数据库,由于我们仅在本地开发,因此可以使用SQLite。
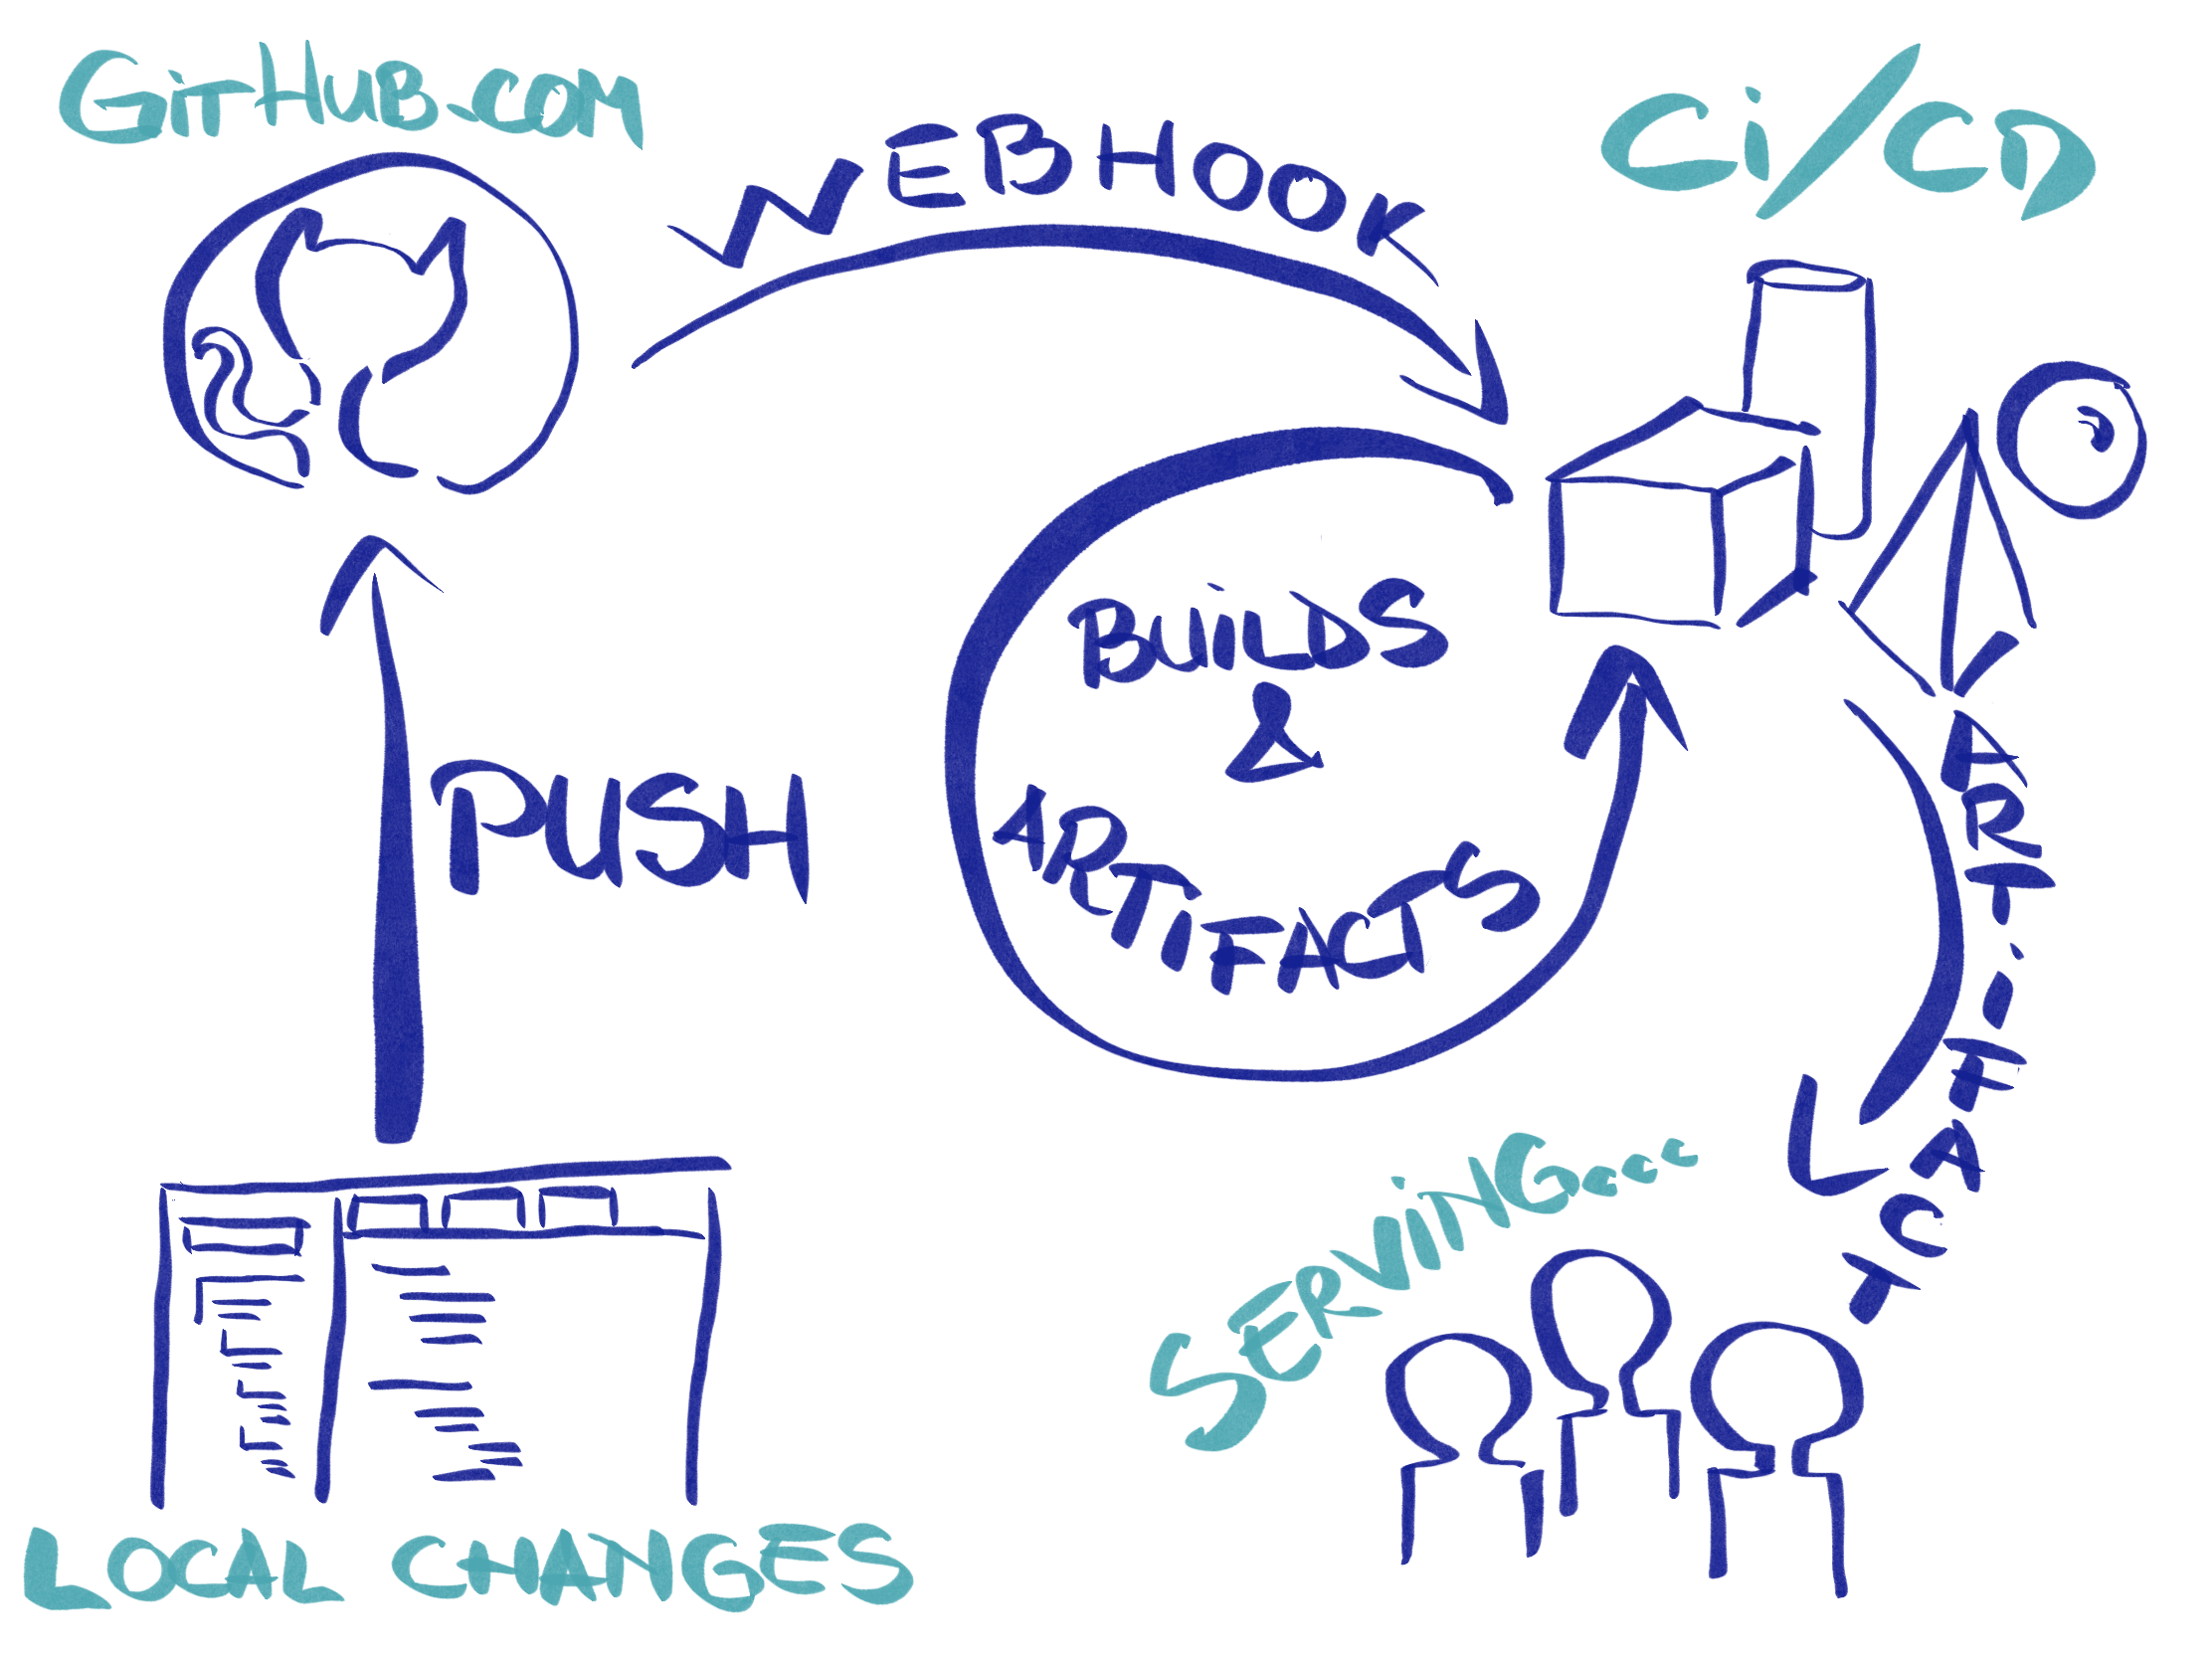
本文中,项目的目的是构建一个系统,使我们能够推送分支代码并将更改部署在单独的环境中,为我们提供唯一的URL 进行检查。与 now.sh 和 heroku.com 的功能类似,我们需要一种机制,可以打包我们的代码和依赖项并进行部署,但同时还需要考虑系统的多版本、升级、负载平衡、扩展及数据库状态。
Indroduction
为了实现这一目标,我们需要两个主要组件:一个组件是获取我们的代码并准备将其发布,即 CI/CD 组件,另一个组件将我们的变更发布到互联网,称为服务组件。我们可以添加第三个组件来保持应用程序的某些状态,例如数据库和存储,但是我们将其添加到服务组件中。
Serving component
对于服务组件,我们可以使用 Knative 。它是基于 Kubernetes 的 Serverless 解决方案,并集成了其他一些在 Kubernetes 上构建的组件。从根本上讲,它可以通过 Docker 运行并公开到互联网,而无需繁琐的部署流程。你只需要定义一个描述镜像及其运行环境的服务, Knative 就会处理其他所有事情(从路由、日志记录、监视到应用程序不同版本的管理以及服务自动扩缩容,包括 0 缩放以停止服务使用)。
可以想象,Knative 要远比上面的描述复杂得多,现阶段我们不会对其进行深入的技术讨论。
Packet
为了继续使用 Knative,我们需要一个 Kubernetes 集群。为了进行过度设计并尝试一些新的东西,让我们尝试在裸机上安装 Kubernetes。这听起来有点不知所措,但最后,它比预期的要简单得多。我一直想尝试 packet.com ,因为它们已经实现了部署的自动化(可以通过 API 进行控制,从而使 Terraform 等工具大放异彩),他们拥有一个市场,在该市场上竞标每小时机器使用量( 称为 Spot Market ,可通过 API 访问)和简洁的联网功能(如 BGP - 边界网关协议,我们在后面就会用到它)。
我们可以从 3 种部署类型中进行选择:按需实例、预留实例和 spot 实例。让我们尝试竞价型 spot 实例,因为这样真的很便宜。
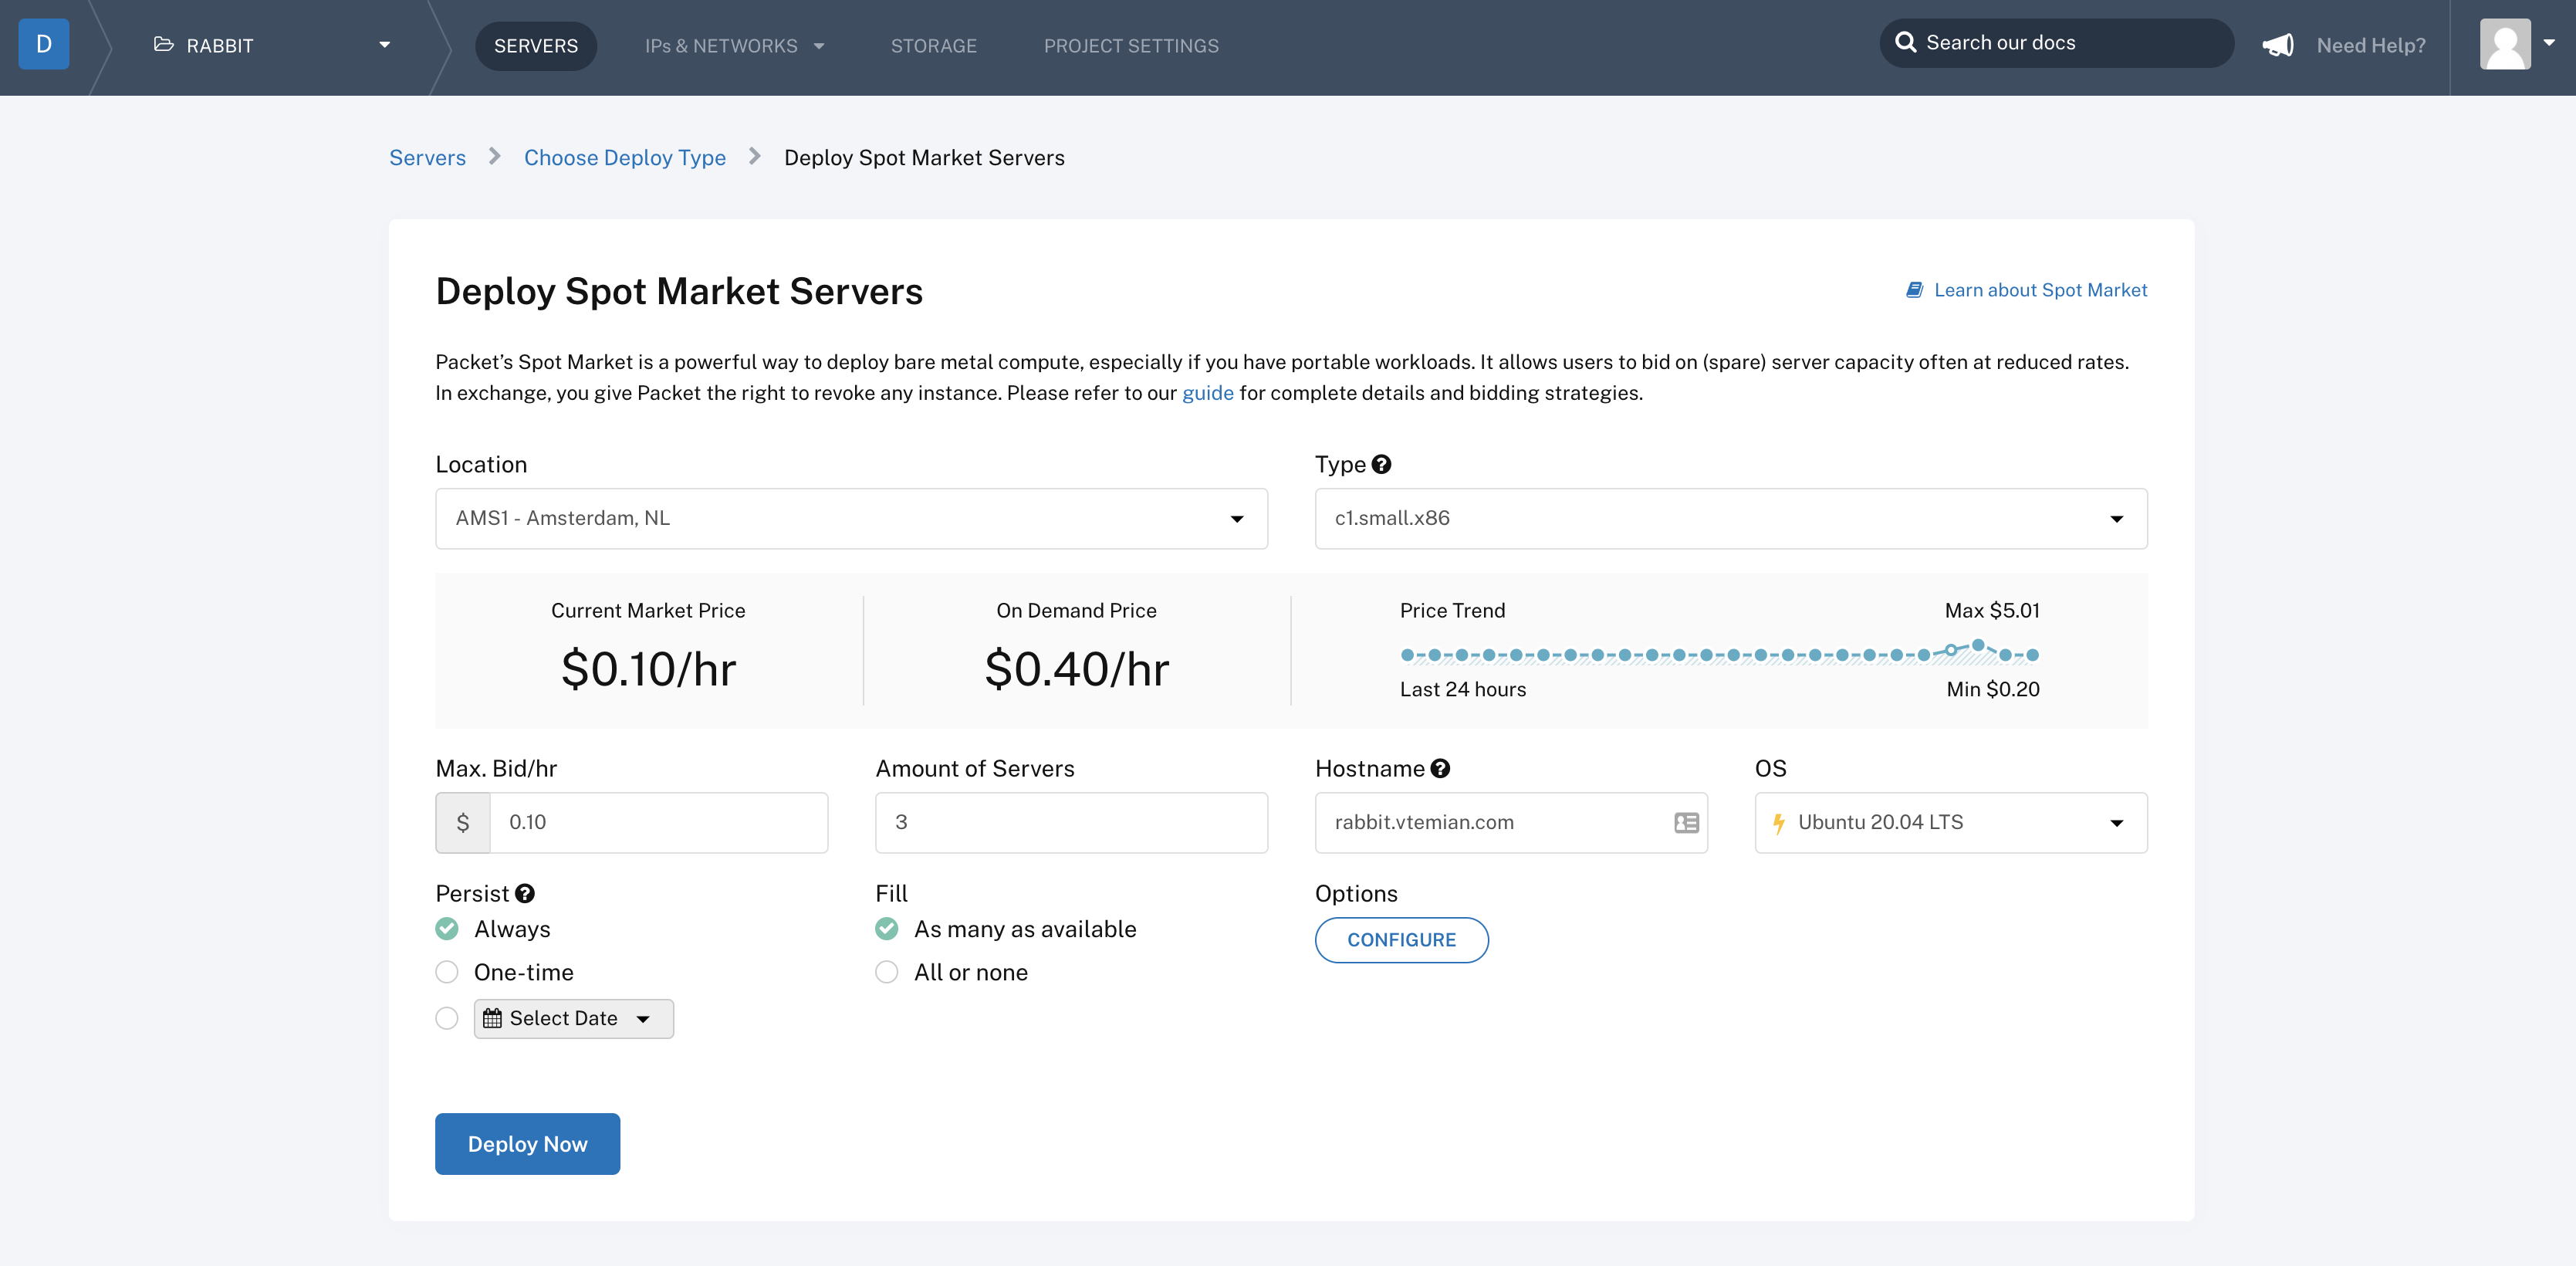
创建 spot 实例市场请求后,它将检查符合您出价的可用机器,并开始配置它们。最高出价为 $ 0.10 / h,我们得到一个 c1.small.x86 实例,它有 4 个运行在 3.4Ghz( Intel E3-1240 v3 )的物理核心、32GB RAM、2 x 120GB SSD 和 2 个千兆网卡。
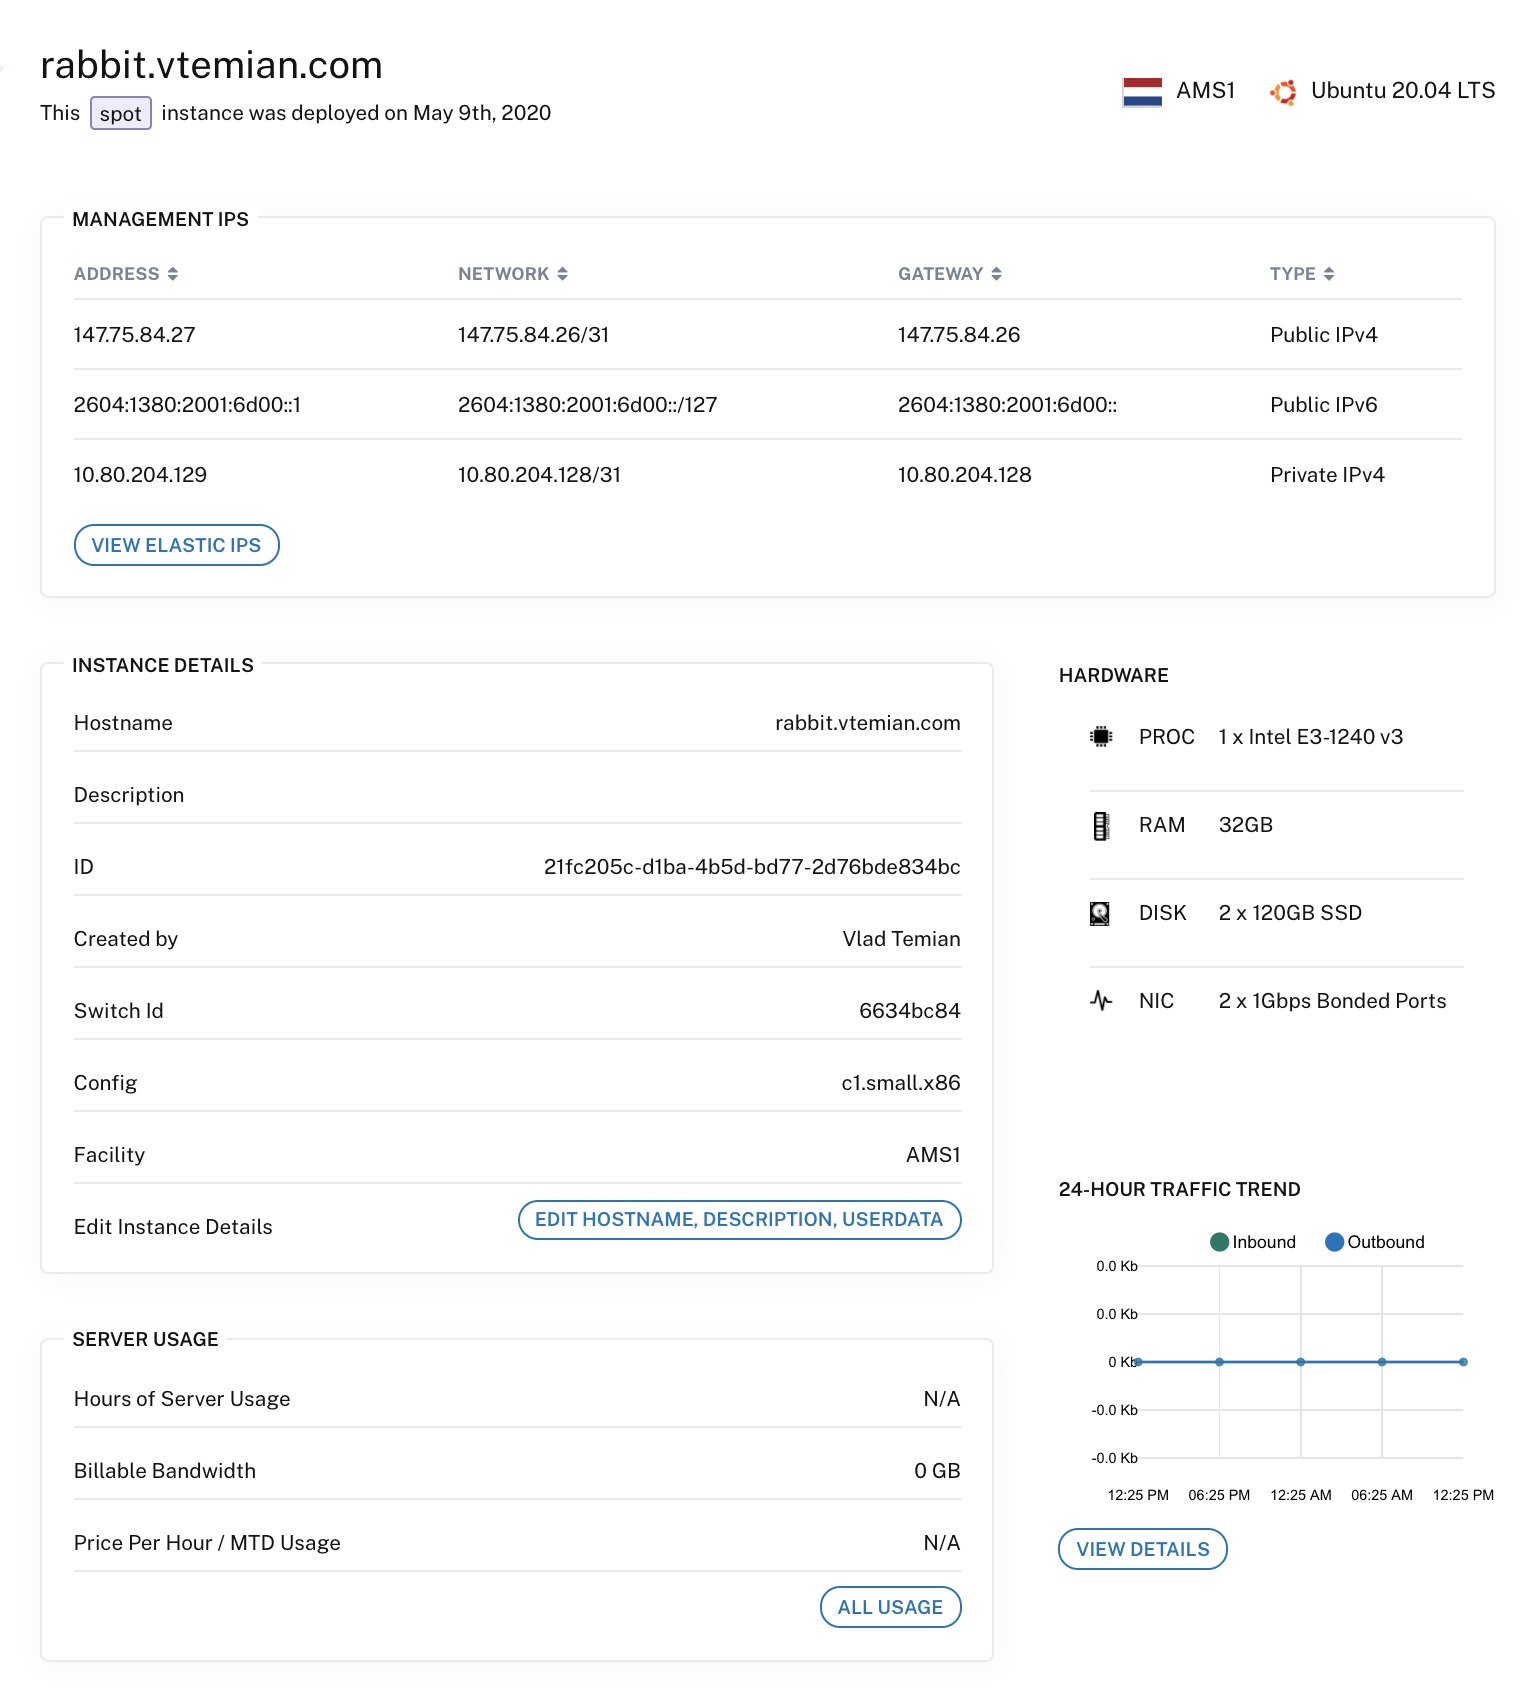
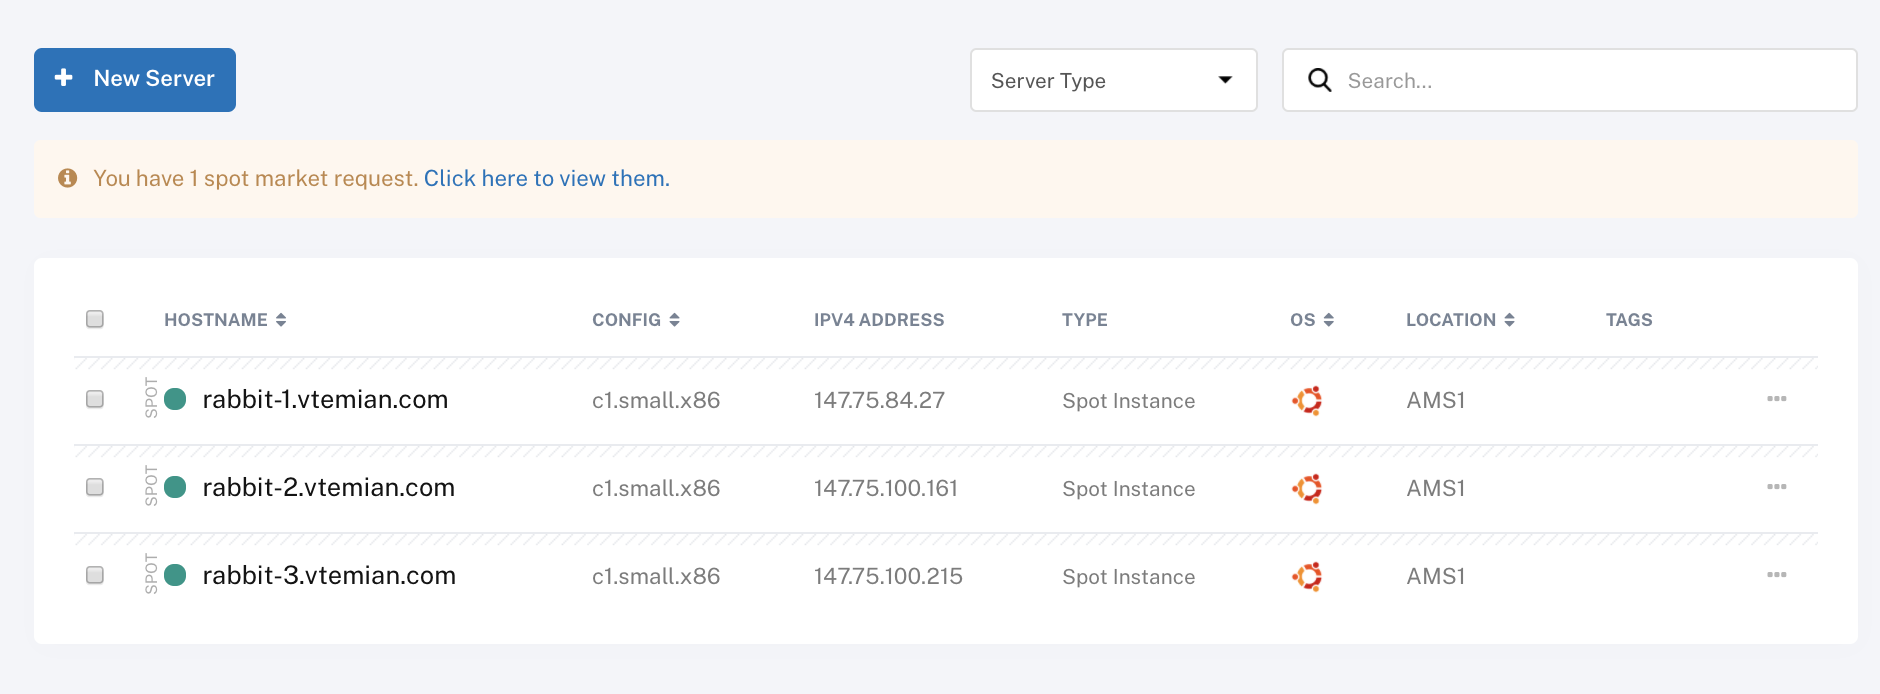
我已经为每台服务器更新了主机名,现在我们可以安装 Kubernetes 了。
Kubernetes on bare-metal
网络上有大量教程,从手动安装所有组件到使用脚本或其他工具裸机安装 Kubernetes。最受欢迎的选择是 kops 、 kubeadm 和 kubespray 。我选择 kubespray,因为对我来说,它更容易理解,并且因为我有一些经验,所以这条路的阻力最小。在这里,你可以了解到kops、kubeadm 和kubespray 之间的差异比较。
Kubespray 易于安装和使用。 我们只需要克隆代码仓库并通过下面的指令安装
复制代码
如果要在服务器上运行不同版本的 ansible,我们也可以将其安装在单独的虚拟环境中。
接下来,我们需要定义服务器清单。它配备了预定义的清单示例。我们能使用 Packet 的 API 列出所有服务器清单,但我决定使用静态方式,只需将 sample 清单资源列表复制到一个独立的清单资源中(重命名为 rabbit)。
复制代码
现在向 inventory.ini 中添加我们的服务器信息。
[all]
rabbit-1.vtemian.com ansible_host=147.75.84.27 ansible_user=root ip=10.80.204.129 etcd_member_name=etcd1
rabbit-2.vtemian.com ansible_host=147.75.100.161 ansible_user=root ip=10.80.204.131 etcd_member_name=etcd2
rabbit-3.vtemian.com ansible_host=147.75.100.215 ansible_user=root ip=10.80.204.133 etcd_member_name=etcd3
[kube-master]
rabbit-1.vtemian.com
[etcd]
rabbit-1.vtemian.com
[kube-node]
rabbit-2.vtemian.com
rabbit-3.vtemian.com
[calico-rr]
[k8s-cluster:children]
kube-master
kube-node
calico-rr
因为当我设置集群时,kubespray 并不完全支持 Ubuntu 20.04,所以我不得不稍微更新一下任务。 我已将 python-minimal替换为 python2-minimal,并从 Ubuntu 19.10(Eoan)仓库中安装 Docker。
接下来,我们只需要运行 ansible 并静候结果。
复制代码
如果一切正常,我们将建立并成功运行一个新集群。为了访问它,我们可以从 kube-master 节点获取管理员凭证。
复制代码
接下来,把它们添加到我们的本地 kubectl 配置中(通常位于〜/.kube /config 中),我们将能够使用 kubectl 访问集群。
╰─>$ kubectl get pod --all-namespaces -o wide
NAMESPACE     NAME                                           READY   STATUS    RESTARTS   AGE     IP              NODE                   NOMINATED NODE   READINESS GATES
kube-system   calico-kube-controllers-5679c8548f-rffvp       1/1     Running   0          2m46s   10.80.204.133   rabbit-3.vtemian.com   <none>           <none>
kube-system   calico-node-6wt2p                              1/1     Running   1          3m12s   10.80.204.129   rabbit-1.vtemian.com   <none>           <none>
kube-system   calico-node-98cnq                              1/1     Running   1          3m12s   10.80.204.131   rabbit-2.vtemian.com   <none>           <none>
kube-system   calico-node-kh9k8                              1/1     Running   1          3m12s   10.80.204.133   rabbit-3.vtemian.com   <none>           <none>
kube-system   coredns-76798d84dd-75tz6                       1/1     Running   0          2m21s   10.233.82.1     rabbit-1.vtemian.com   <none>           <none>
kube-system   coredns-76798d84dd-bqt66                       1/1     Running   0          2m17s   10.233.80.1     rabbit-3.vtemian.com   <none>           <none>
kube-system   dns-autoscaler-85f898cd5c-nskgf                1/1     Running   0          2m18s   10.233.82.2     rabbit-1.vtemian.com   <none>           <none>
kube-system   kube-apiserver-rabbit-1.vtemian.com            1/1     Running   0          4m58s   10.80.204.129   rabbit-1.vtemian.com   <none>           <none>
kube-system   kube-controller-manager-rabbit-1.vtemian.com   1/1     Running   0          4m58s   10.80.204.129   rabbit-1.vtemian.com   <none>           <none>
kube-system   kube-proxy-4ktbs                               1/1     Running   0          3m34s   10.80.204.131   rabbit-2.vtemian.com   <none>           <none>
kube-system   kube-proxy-kd6n2                               1/1     Running   0          3m34s   10.80.204.133   rabbit-3.vtemian.com   <none>           <none>
kube-system   kube-proxy-ts8nw                               1/1     Running   0          3m34s   10.80.204.129   rabbit-1.vtemian.com   <none>           <none>
kube-system   kube-scheduler-rabbit-1.vtemian.com            1/1     Running   0          4m58s   10.80.204.129   rabbit-1.vtemian.com   <none>           <none>
kube-system   kubernetes-dashboard-77475cf576-7sdr6          1/1     Running   0          2m15s   10.233.83.2     rabbit-2.vtemian.com   <none>           <none>
kube-system   kubernetes-metrics-scraper-747b4fd5cd-k96pn    1/1     Running   0          2m15s   10.233.83.1     rabbit-2.vtemian.com   <none>           <none>
kube-system   nginx-proxy-rabbit-2.vtemian.com               1/1     Running   0          3m35s   10.80.204.131   rabbit-2.vtemian.com   <none>           <none>
kube-system   nginx-proxy-rabbit-3.vtemian.com               1/1     Running   0          3m36s   10.80.204.133   rabbit-3.vtemian.com   <none>           <none>
kube-system   nodelocaldns-9l6vf                             1/1     Running   0          2m17s   10.80.204.133   rabbit-3.vtemian.com   <none>           <none>
kube-system   nodelocaldns-blbcb                             1/1     Running   0          2m17s   10.80.204.131   rabbit-2.vtemian.com   <none>           <none>
kube-system   nodelocaldns-vrspt                             1/1     Running   0          2m17s   10.80.204.129   rabbit-1.vtemian.com   <none>           <none>
MetalB
接下来,我们应该能够安装 Knative 了。路由组件是 Knative 安装的一大步骤。它支持多个网络层(Ambassador、Contour、Glo、Istio 和 Kourier)。唯一的问题是这些层需要一个负载均衡器,该负载均衡器将暴露给 Internet(一个外部 LoadBalancer )。Kubernetes 没有对此的本地支持。 基本上,当前的实现是供应商(AWS、GCP、Azure 等)特定的,并且由于使用的是裸机,因此我们暂时负担不起使用其中一种。
幸运的是,有一个名为 MetalLB 的裸机实现。它可以通过两种方式做到这一点:在第2 层使用ARP /NDP 或利用 BGP 。 因为 Packet 已经支持 BGP ,并且它们还提供了一个有关如何配置 MetalLB 的有用示例,接下来我们会尝试一下。
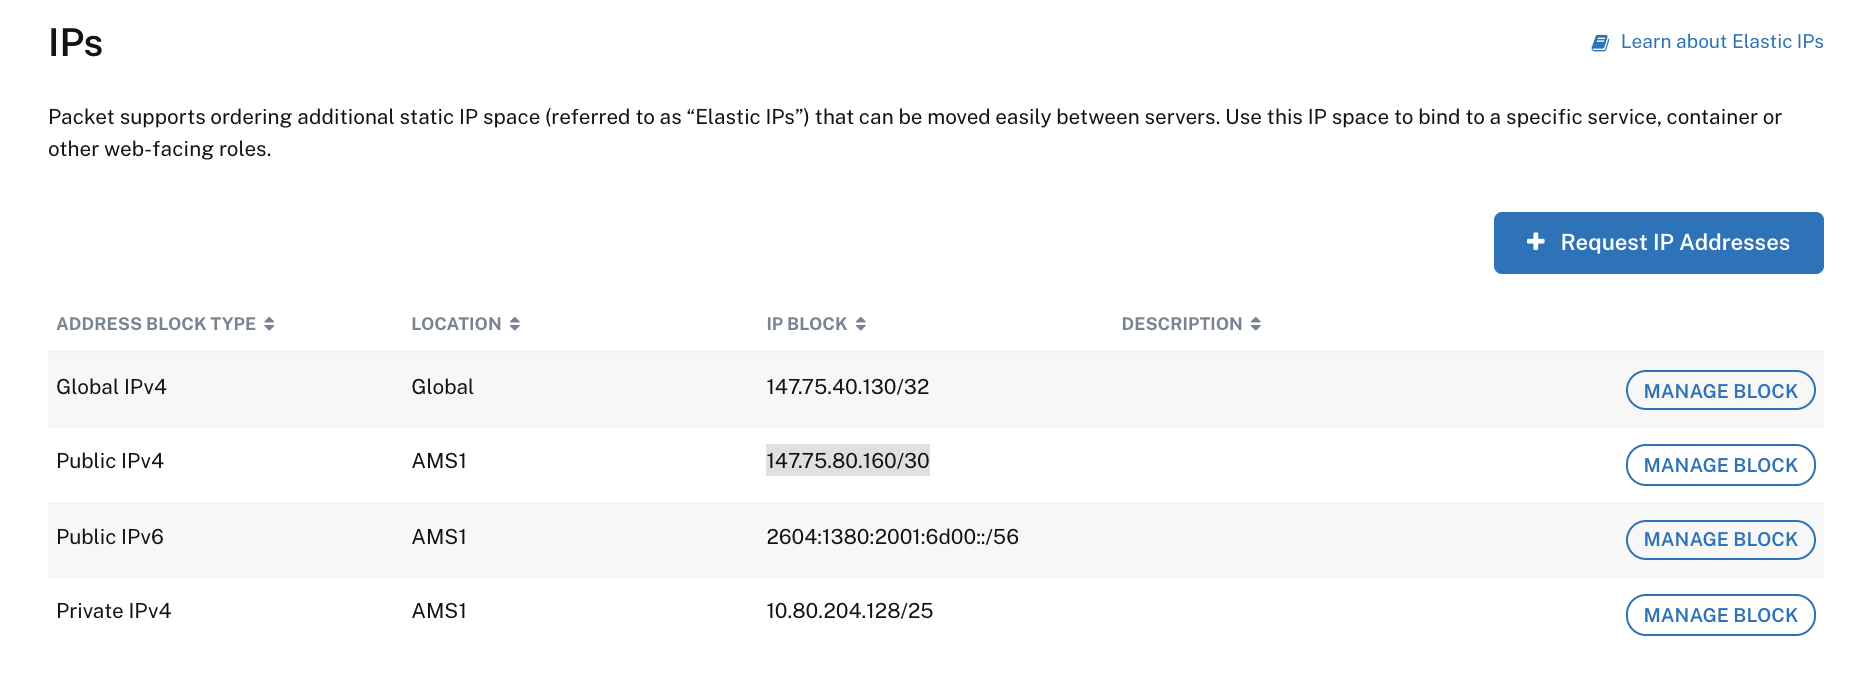
Packet 的 BGP-Kubernetes集成有详细说明文档。我们只需要小心处理IPPools。在定义它们之前,我已经配置了两组弹性IP:
全局IP 147.75.40.130/32 和公用IPv4 147.75.80.160/30。
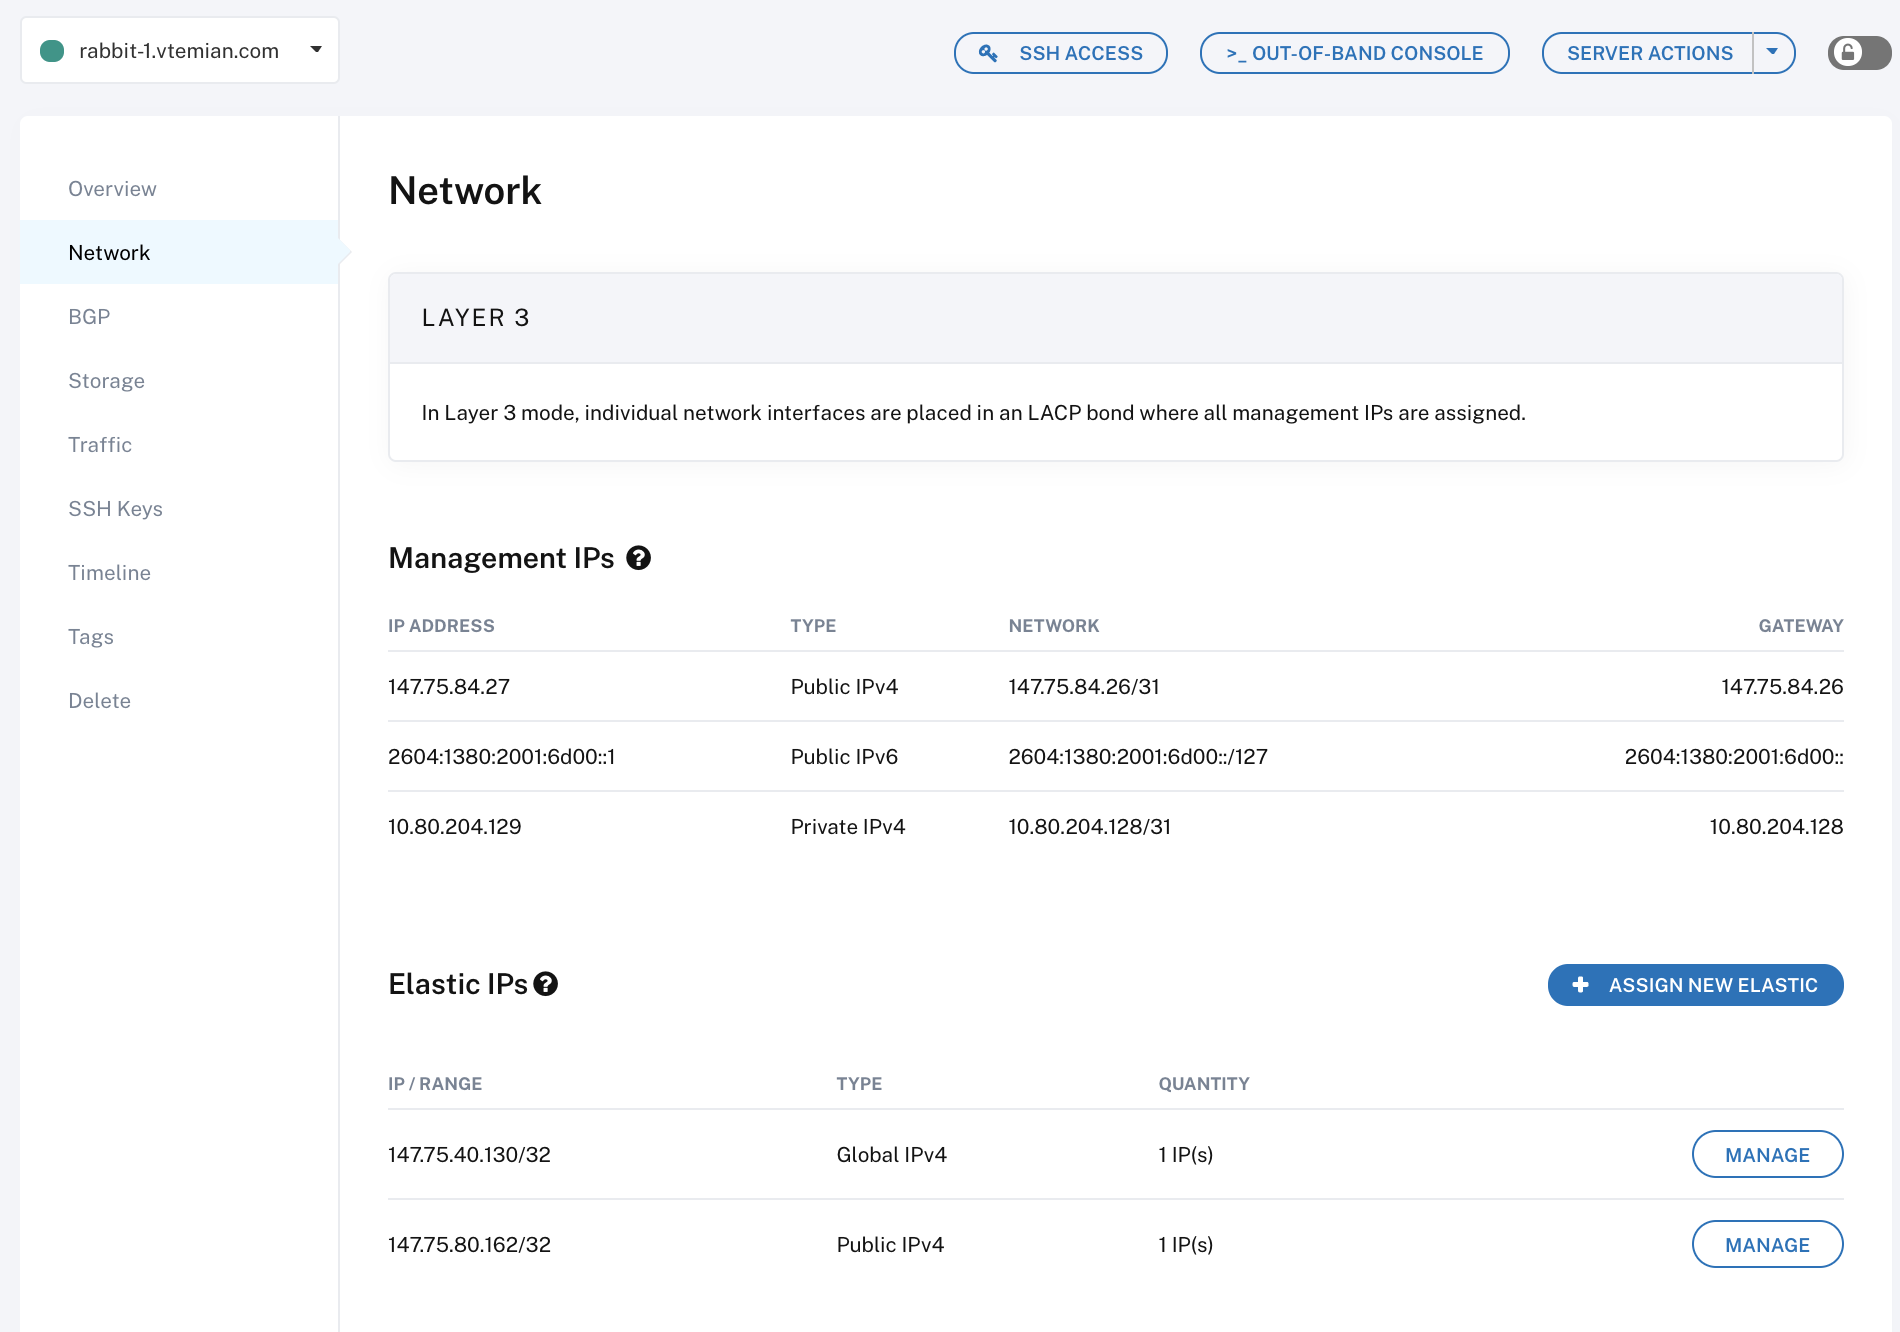
出于安全原因,需要为每台服务器手动配置IP。这相对容易做到并且操作文档可查。对于每个服务器,从网络分段为它们附加一个IP:
然后,在每个服务器上手动(或通过ansible)(例如,Ubuntu / Debian 的一个示例)运行:
复制代码
要使其永久生效,我们需要编辑 /etc/network/interfaces
复制代码
继续 IPPools 配置,metallb-ewr1-public 将配置 147.75.80.160/30,metallb-global-ips 将配置 147.75.40.130/32,对于 metallb-private 将配置我们的私有节点子网,在当前情况下应该是 10.80.204.128/29。你可以使用节点的专用 ip 和 CIDR-IP 转换工具。
对于每一个calico peer 配置,我们将配置节点专用IP。接下来,我们将安装最新的metalLB:
复制代码
在 metallb-system 命名空间中紧跟 metalLB 的配置映射:
apiVersion: v1
kind: ConfigMap
metadata:
  namespace: metallb-system
  name: config
data:
  config: |
    peers:
    - peer-address: 127.0.0.1
      peer-asn: 65000
      my-asn: 65480
    address-pools:
    - name: ewr1-public
      protocol: bgp
      addresses:
      - 147.75.80.160/30
    - name: ewr1-private
      protocol: bgp
      addresses:
      - 10.80.204.128/29
    - name: global-ip
      protocol: bgp
      addresses:
      - 147.75.40.130/32
我们可以通过在主节点中运行calicoctl node status来检查所有配置是否正确:
root@rabbit-1:~# calicoctl node status
Calico process is running.
IPv4 BGP status
+----------------+-------------------+-------+----------+-------------+
|  PEER ADDRESS  |     PEER TYPE     | STATE |  SINCE   |    INFO     |
+----------------+-------------------+-------+----------+-------------+
| 147.75.100.215 | node-to-node mesh | up    | 13:46:38 | Established |
| 127.0.0.1      | global            | up    | 13:51:44 | Established |
| 147.75.100.161 | node-to-node mesh | up    | 13:47:27 | Established |
+----------------+-------------------+-------+----------+-------------+
以及其他 kubectl 命令:
╰─>$ kubectl get pod -n kube-system -o wide | grep calico-node
calico-node-479fz                              1/1     Running   0          8m25s   10.80.204.133   rabbit-3.vtemian.com   <none>           <none>
calico-node-846gr                              1/1     Running   0          7m18s   10.80.204.131   rabbit-2.vtemian.com   <none>           <none>
calico-node-tpnjc                              1/1     Running   0          8m8s    10.80.204.129   rabbit-1.vtemian.com   <none>           <none>
╰─>$ kubectl get pod -n metallb-system -o wide
NAME                          READY   STATUS    RESTARTS   AGE    IP              NODE                   NOMINATED NODE   READINESS GATES
controller-6bcfdfd677-nxnw8   1/1     Running   0          5m4s   10.233.65.193   rabbit-3.vtemian.com   <none>           <none>
speaker-d6kks                 1/1     Running   0          5m4s   10.80.204.131   rabbit-2.vtemian.com   <none>           <none>
speaker-kk85w                 1/1     Running   0          5m4s   10.80.204.133   rabbit-3.vtemian.com   <none>           <none>
speaker-p4lc7                 1/1     Running   0          5m4s   10.80.204.129   rabbit-1.vtemian.com   <none>           <none>
Istio
现在,我们已经启动并运行了 MetalLB,我们可以继续使用最后一个路由组件。在 Knative 支持的所有这些网络组件中,我选择了 Istio ,因为它是唯一与 Knative 运营商兼容的组件(将在后面进行介绍)。
我们只需要按照主安装页面上的说明进行操作,如果一切正常,我们将拥有一个带有外部 IP 的负载均衡器。
╰─>$ kubectl get service --all-namespaces
NAMESPACE      NAME                        TYPE           CLUSTER-IP      EXTERNAL-IP     PORT(S)                                                                                                                                      AGE
default        kubernetes                  ClusterIP      10.233.0.1      <none>          443/TCP                                                                                                                                      101m
istio-system   istio-ingressgateway        LoadBalancer   10.233.24.125   147.75.80.160   15020:30935/TCP,80:31380/TCP,443:31390/TCP,31400:31400/TCP,15029:31350/TCP,15030:31699/TCP,15031:32315/TCP,15032:31519/TCP,15443:32542/TCP   55s
istio-system   istio-pilot                 ClusterIP      10.233.48.55    <none>          15010/TCP,15011/TCP,8080/TCP,15014/TCP                                                                                                       55s
kube-system    coredns                     ClusterIP      10.233.0.3      <none>          53/UDP,53/TCP,9153/TCP                                                                                                                       98m
kube-system    dashboard-metrics-scraper   ClusterIP      10.233.61.223   <none>          8000/TCP                                                                                                                                     97m
kube-system    kubernetes-dashboard        ClusterIP      10.233.16.174   <none>          443/TCP                                                                                                                                      97m
Knative
我们已经准备好安装 Knative 了。我发现更简单的方法是安装 operator,它将进一步安装所有组件。 我尝试过手动安装每个组件,那样的话会异常麻烦。
现在,我们需要将 operator 安装在默认命名空间中,因为它将在其中查找名为 config-logging 的 ConfigMap(配置映射表)。
复制代码
╰─>$ kubens default╰─>$ kubectl apply -f https://github.com/knative-sandbox/operator/releases/download/v0.14.1/operator.yaml
一旦 CRDs 安装成功后,operator 对应的 pod 可以运行生效。
复制代码
╰─>$ kubectl get podsNAME READY STATUS RESTARTS AGEknative-eventing-operator-5847fcc5d5-d4cb4 1/1 Running 0 53sknative-serving-operator-587dcd9f85-zlx7v 1/1 Running 0 53s
我们可以创建 KnativeServing 和 KnativeEventing 资源:
复制代码
╰─>$ cat <<-EOF | kubectl apply -f -apiVersion: operator.knative.dev/v1alpha1kind: KnativeServingmetadata:name: ksEOF╰─>$ cat <<-EOF | kubectl apply -f -apiVersion: v1kind: Namespacemetadata:name: knative-eventing---apiVersion: operator.knative.dev/v1alpha1kind: KnativeEventingmetadata:name: kenamespace: knative-eventingEOF
新的 pod 和资源会在默认和 knative-eventing 命名空间中安装完成
复制代码
╰─>$ kubectl get pods --all-namespaces -o wideNAMESPACE NAME READY STATUS RESTARTS AGE IP NODE NOMINATED NODE READINESS GATESdefault activator-65fc4d666-7bwst 1/1 Running 0 39s 10.233.125.68 rabbit-2.vtemian.com <none> <none>default autoscaler-74b4bb97bd-ghj59 1/1 Running 0 38s 10.233.65.195 rabbit-3.vtemian.com <none> <none>default autoscaler-hpa-594f68d5c4-8qtg4 1/1 Running 0 30s 10.233.65.198 rabbit-3.vtemian.com <none> <none>default controller-6b6978c965-rqb2z 1/1 Running 0 37s 10.233.65.196 rabbit-3.vtemian.com <none> <none>default istio-webhook-856d84fbf9-wvpph 1/1 Running 0 26s 10.233.125.71 rabbit-2.vtemian.com <none> <none>default knative-eventing-operator-5847fcc5d5-d4cb4 1/1 Running 0 3m18s 10.233.125.67 rabbit-2.vtemian.com <none> <none>default knative-serving-operator-587dcd9f85-zlx7v 1/1 Running 0 3m18s 10.233.125.66 rabbit-2.vtemian.com <none> <none>default networking-istio-6845f7cf59-bsqc2 1/1 Running 0 26s 10.233.125.69 rabbit-2.vtemian.com <none> <none>default webhook-577576647-wrw56 1/1 Running 0 36s 10.233.65.197 rabbit-3.vtemian.com <none> <none>istio-system istio-ingressgateway-75694cd848-l6zfh 1/1 Running 0 64m 10.233.125.65 rabbit-2.vtemian.com <none> <none>istio-system istio-pilot-576d858689-zxv76 1/1 Running 0 64m 10.233.65.194 rabbit-3.vtemian.com <none> <none>knative-eventing broker-controller-854447b8d7-vdmdz 1/1 Running 0 18s 10.233.65.200 rabbit-3.vtemian.com <none> <none>knative-eventing broker-filter-b54b58854-w9jvw 1/1 Running 0 17s 10.233.125.72 rabbit-2.vtemian.com <none> <none>knative-eventing broker-ingress-75b6b8df8d-mlppj 1/1 Running 0 16s 10.233.65.201 rabbit-3.vtemian.com <none> <none>knative-eventing eventing-controller-694594fdd7-gj2br 1/1 Running 0 26s 10.233.125.70 rabbit-2.vtemian.com <none> <none>knative-eventing eventing-webhook-6c6b675b6f-t4ntx 1/1 Running 0 26s 10.233.65.199 rabbit-3.vtemian.com <none> <none>knative-eventing imc-controller-7bb9bd7c6d-q2tsz 1/1 Running 0 10s 10.233.125.73 rabbit-2.vtemian.com <none> <none>knative-eventing imc-dispatcher-6cc5c74c7f-kdj7v 1/1 Running 0 10s 10.233.125.74 rabbit-2.vtemian.com <none> <none>knative-eventing mt-broker-controller-75ddc75d57-rg6jd 1/1 Running 0 15s 10.233.65.202 rabbit-3.vtemian.com <none> <none>knative-eventing v0.14.0-upgrade-4sv89 0/1 Completed 0 9s 10.233.65.203 rabbit-3.vtemian.com <none> <none>
在实际测试前,让我们配置一下 DNS 组件。每次创建新部署时,我们都希望有一个唯一的 URL。Knative 可以使用 xip.io 做到这一点,我们只需要创建一个作业(我们将其安装在默认名称空间中)即可:
复制代码
╰─>$ kubectl apply --filename https://storage.googleapis.com/knative-nightly/serving/latest/serving-default-domain.yaml
First Knative service
在我们的初始应用程序中,我创建了一个简单的 Dockerfile :
复制代码
FROM python:3.7-slimWORKDIR /appCOPY requirements.txt ./RUN pip install -r requirements.txtCOPY app ./CMD exec gunicorn app.wsgi --bind :$PORT --workers 1 --threads 8 --timeout 0
并在vtemian/simple-django-app下公开发布图片。
复制代码
╰─>$ docker push vtemian/simple-django-appThe push refers to repository [docker.io/vtemian/simple-django-app]7aa16540cfca: Pushed2e02cc50aabc: Pushed768f0318f857: Pushed663045c38f65: Pushed715414420313: Mounted from vtemian/helloworld-pythondba4fa00b93a: Mounted from vtemian/helloworld-python9f690547ed37: Mounted from vtemian/helloworld-python6376837eded8: Mounted from vtemian/helloworld-pythonc2adabaecedb: Mounted from vtemian/helloworld-pythonlatest: digest: sha256:78799d85949e31728c70ef3dbf3a492d932fc94c140cf1047d948c89141f55ab size: 2205
要将其发布到我们的 Knative 中,我们只需要定义一个服务:
复制代码
apiVersion: serving.knative.dev/v1kind: Servicemetadata:name: simple-django-appnamespace: defaultspec:template:spec:containers:- image: docker.io/vtemian/simple-django-app
执行kubectl get ksvc:
复制代码
╰─>$ kubectl get ksvcNAME URL LATESTCREATED LATESTREADY READY REASONsimple-django-app http://simple-django-app.default.147.75.80.160.xip.io simple-django-app-hc2qv Unknown RevisionMissing
转到上面生成的 URL:
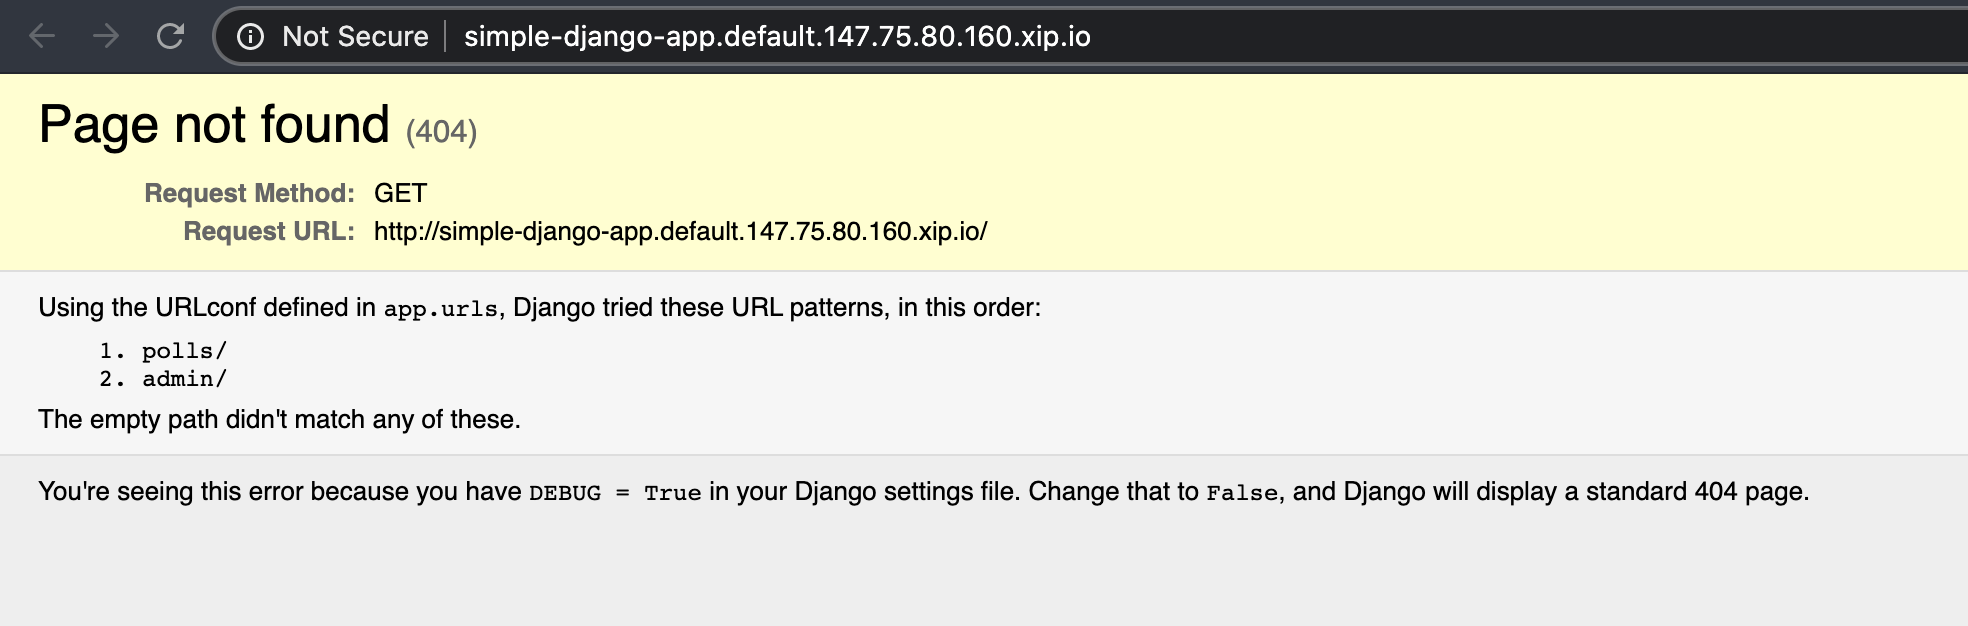
这个……这真是太酷了!没有数据库,我们仍然需要构建容器,但是这看起来真的很酷!
ElasticSearch 和 Kibana
在进一步测试之前,让我们配置一些可视化工具,例如用于日志分析的 ElasticSearch + Kibana 和用于指标监控的 Prometheus + Grafana。
让我们从指标组件开始。我们将按照文档进行操作,只需要编辑 config-observability 配置。它已经为我们提供了一个配置示例,我们将继续使用它。只是暂时简化示例。 接下来,我们需要创建 knative-monitoring 命名空间,并应用该清单:
复制代码
╰─>$ kubectl apply --filename https://storage.googleapis.com/knative-nightly/serving/latest/monitoring-metrics-prometheus.yaml
容器应在 knative-monitoring 命名空间中启动并运行:
复制代码
╰─>$ kubectl get pod -n knative-monitoring -o wideNAME READY STATUS RESTARTS AGE IP NODE NOMINATED NODE READINESS GATESgrafana-c9c94bdff-5f77v 1/1 Running 0 2m3s 10.233.65.210 rabbit-3.vtemian.com <none> <none>kube-state-metrics-b6bcff8f4-tvp46 1/1 Running 0 2m7s 10.233.65.209 rabbit-3.vtemian.com <none> <none>node-exporter-9wkpn 2/2 Running 0 2m4s 10.80.204.131 rabbit-2.vtemian.com <none> <none>node-exporter-lfjss 2/2 Running 0 2m4s 10.80.204.129 rabbit-1.vtemian.com <none> <none>node-exporter-zjl7b 2/2 Running 0 2m4s 10.80.204.133 rabbit-3.vtemian.com <none> <none>prometheus-system-0 1/1 Running 0 2m1s 10.233.65.211 rabbit-3.vtemian.com <none> <none>prometheus-system-1 1/1 Running 0 2m1s 10.233.125.75 rabbit-2.vtemian.com <none> <none>
Grafana 默认带有一些非常漂亮的仪表板,并且可以配置 Prometheus 为数据源。唯一的问题是 Prometheus 配置的不是当前正在运行的服务。我们需要获取所有当前正在运行的服务,并检查 Prometheus 服务名称,在本例中服务名为Prometheus-system-discovery。
复制代码
╰─>$ kubectl -n knative-monitoring get serviceNAME TYPE CLUSTER-IP EXTERNAL-IP PORT(S) AGEkube-controller-manager ClusterIP None <none> 10252/TCP 5m36skube-state-metrics ClusterIP 10.233.56.244 <none> 8080/TCP,8081/TCP 5m41snode-exporter ClusterIP None <none> 9100/TCP 5m38sprometheus-system-discovery ClusterIP None <none> 9090/TCP 5m36s
我们将配置 Grafana 的配置文件,并将 Pormetheus 的 URL 替换为http://prometheus-system-discovery.knative-monitoring.svc:9090
复制代码
╰─>$ kubectl -n knative-monitoring edit cm grafana-datasourcesapiVersion: v1data:prometheus.yaml: |datasources:- name: prometheustype: prometheusaccess: proxyorg_id: 1url: http://prometheus-system-discovery.knative-monitoring.svc:9090version: 1editable: false
删除当前正在运行的 Grafana 容器
复制代码
╰─>$ kubectl delete po -n knative-monitoring --selector=app=grafanapod "grafana-c9c94bdff-rkvrg" deleted
等待新的 Pod 启动后,你可以通过指定端口访问
复制代码
╰─>$ kubectl port-forward --namespace knative-monitoring \(kubectl get pods --namespace knative-monitoring \--selector=app=grafana --output=jsonpath="{.items..metadata.name}") \3000Forwarding from 127.0.0.1:3000 -> 3000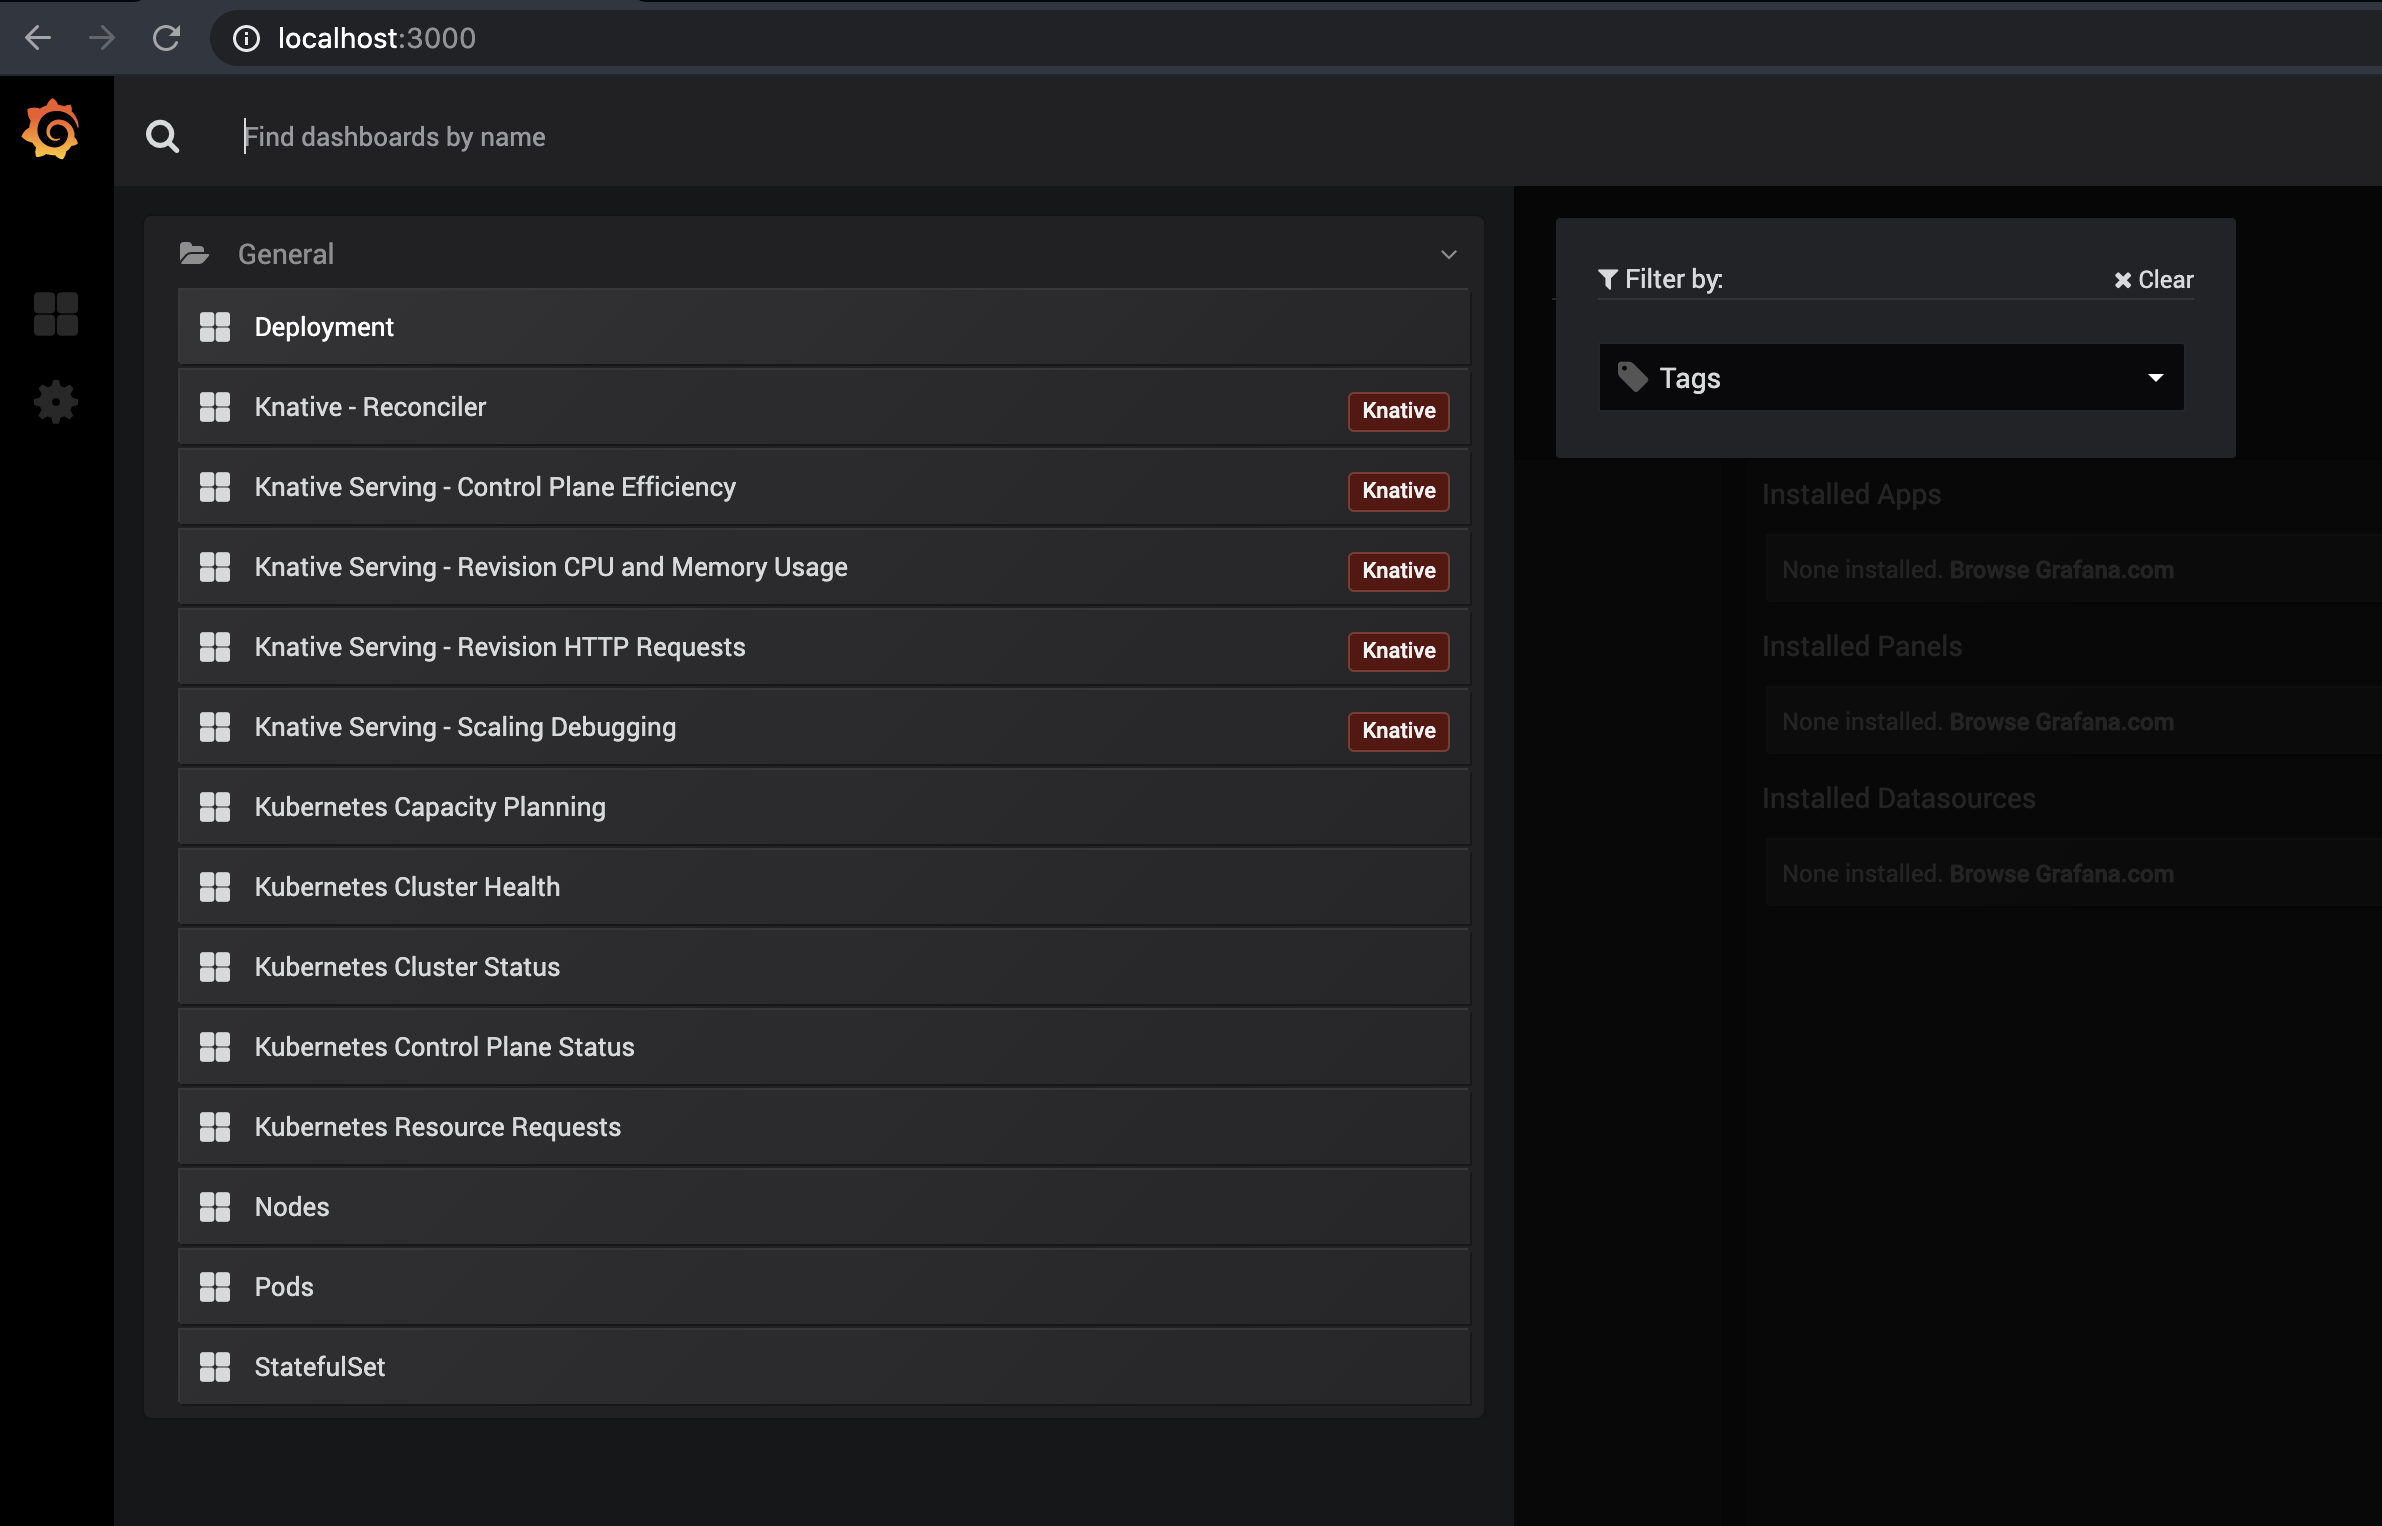
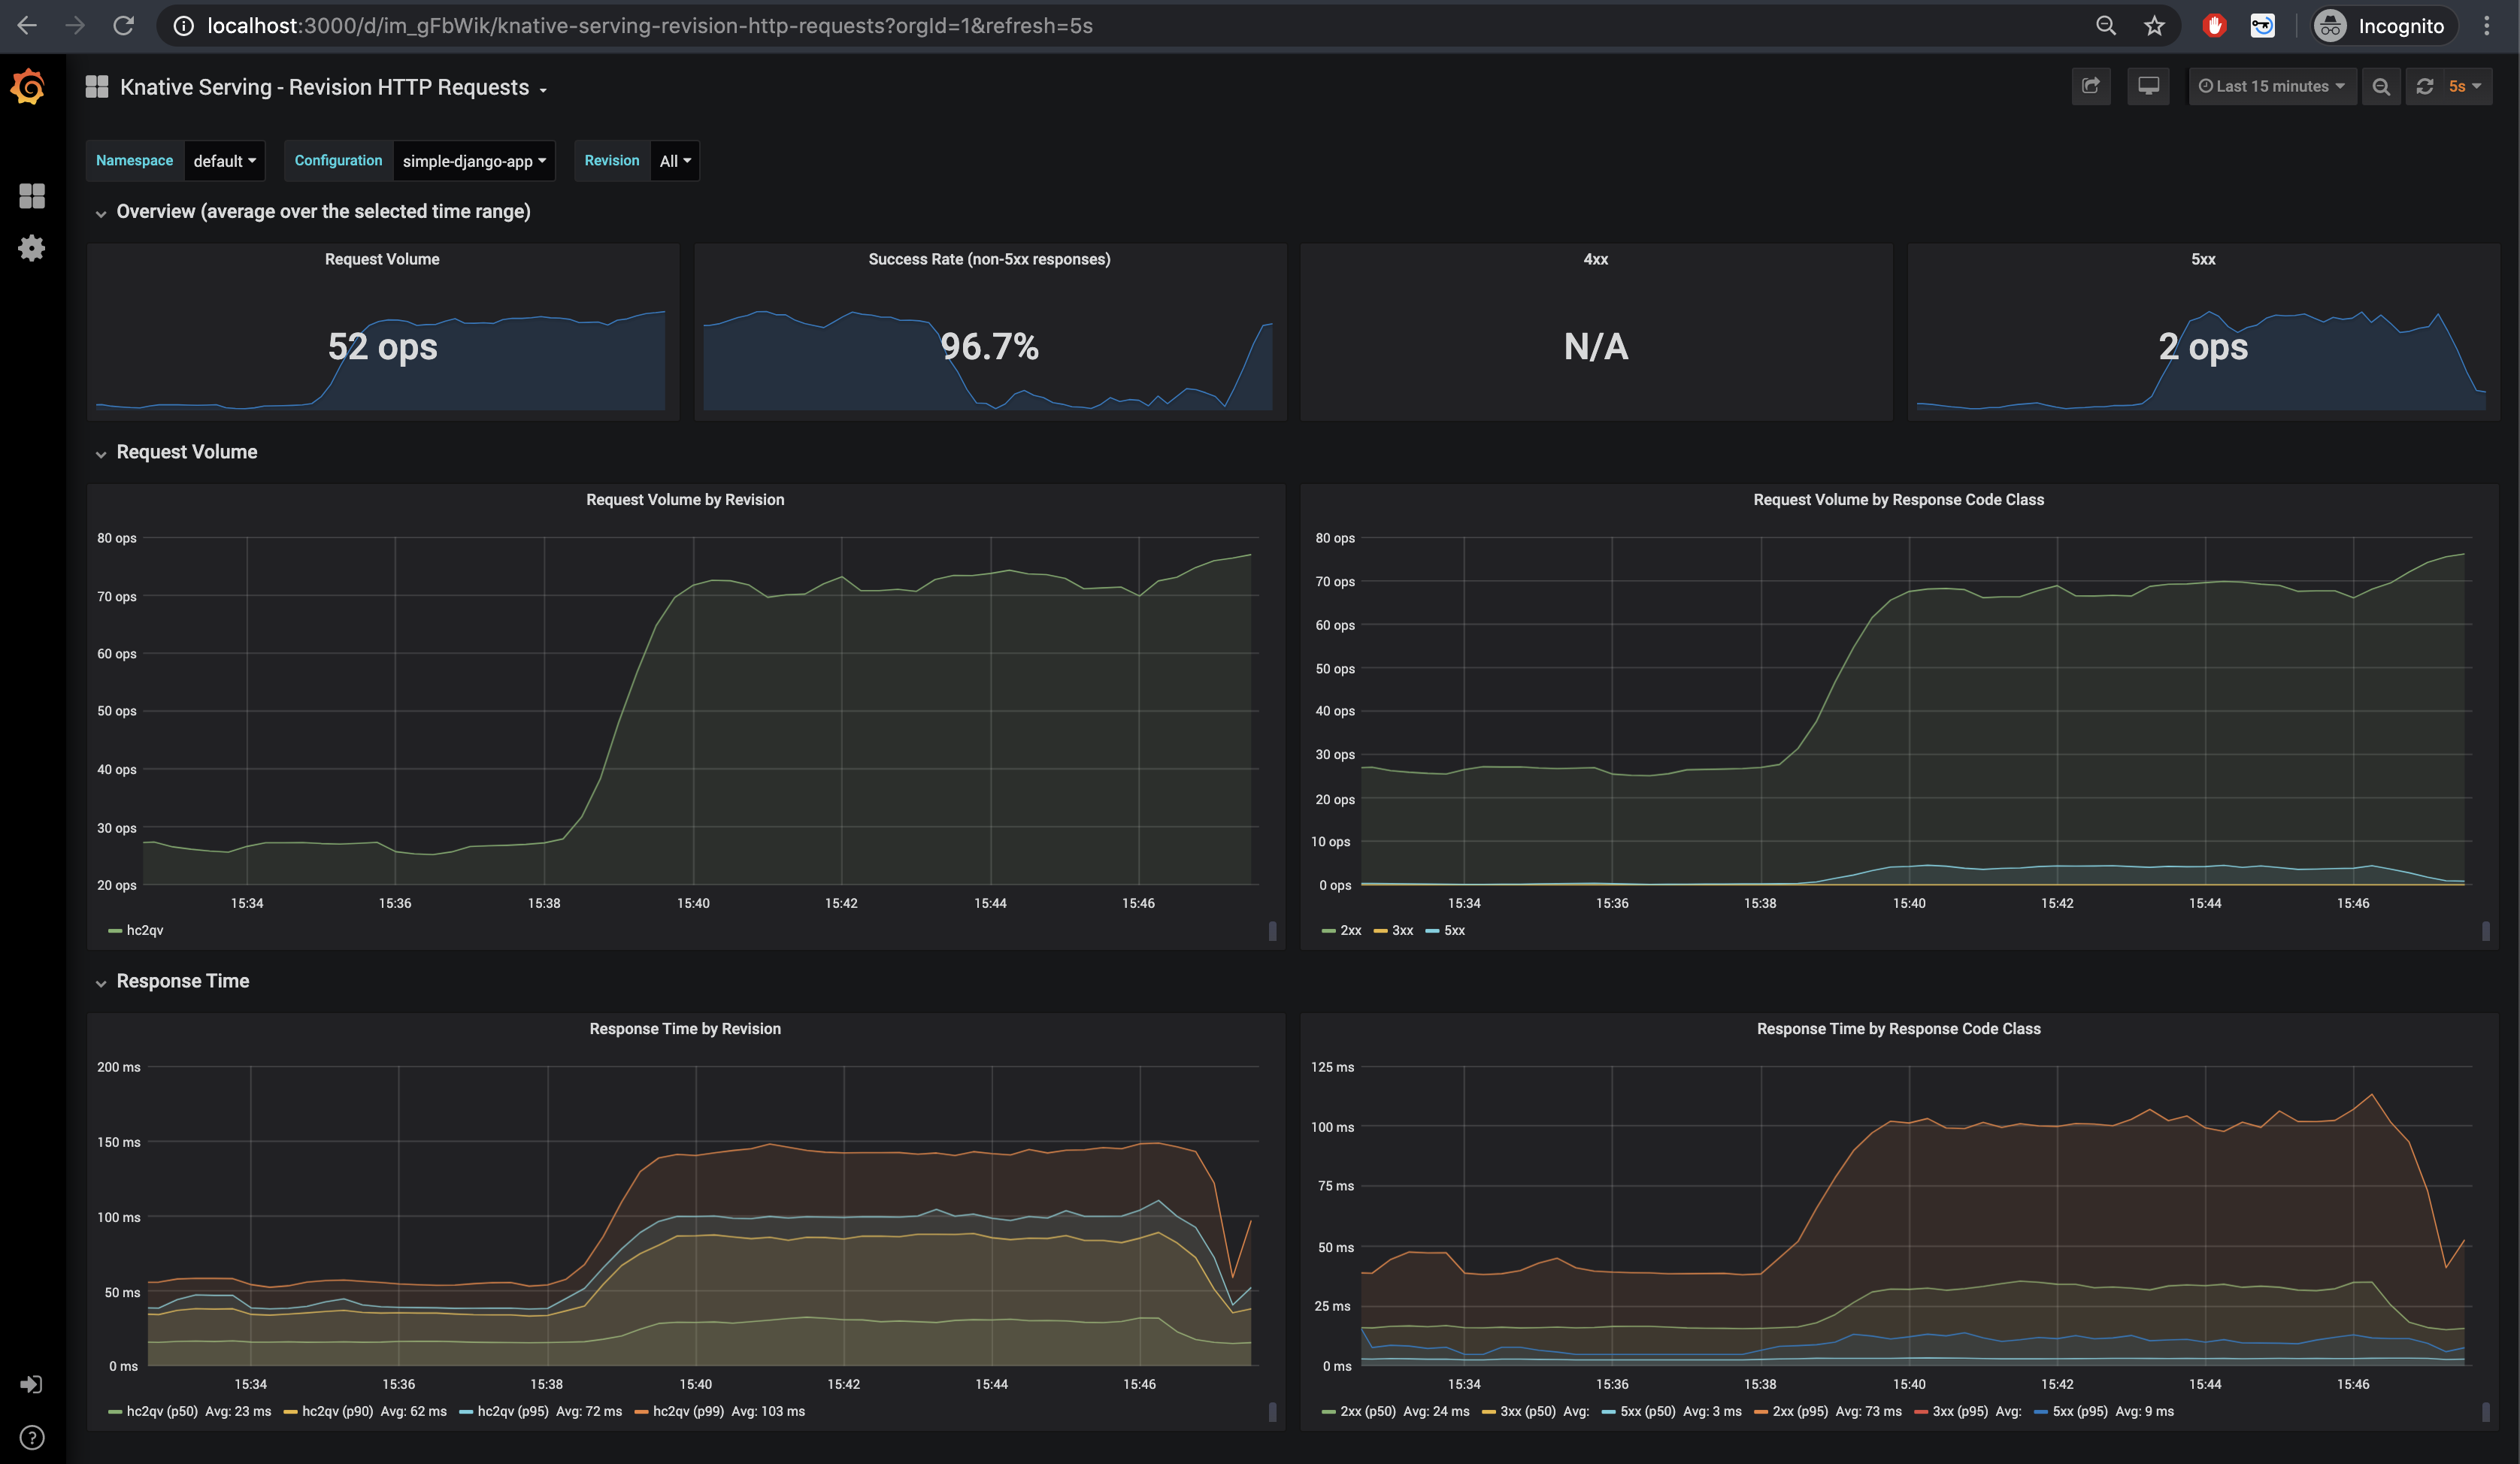
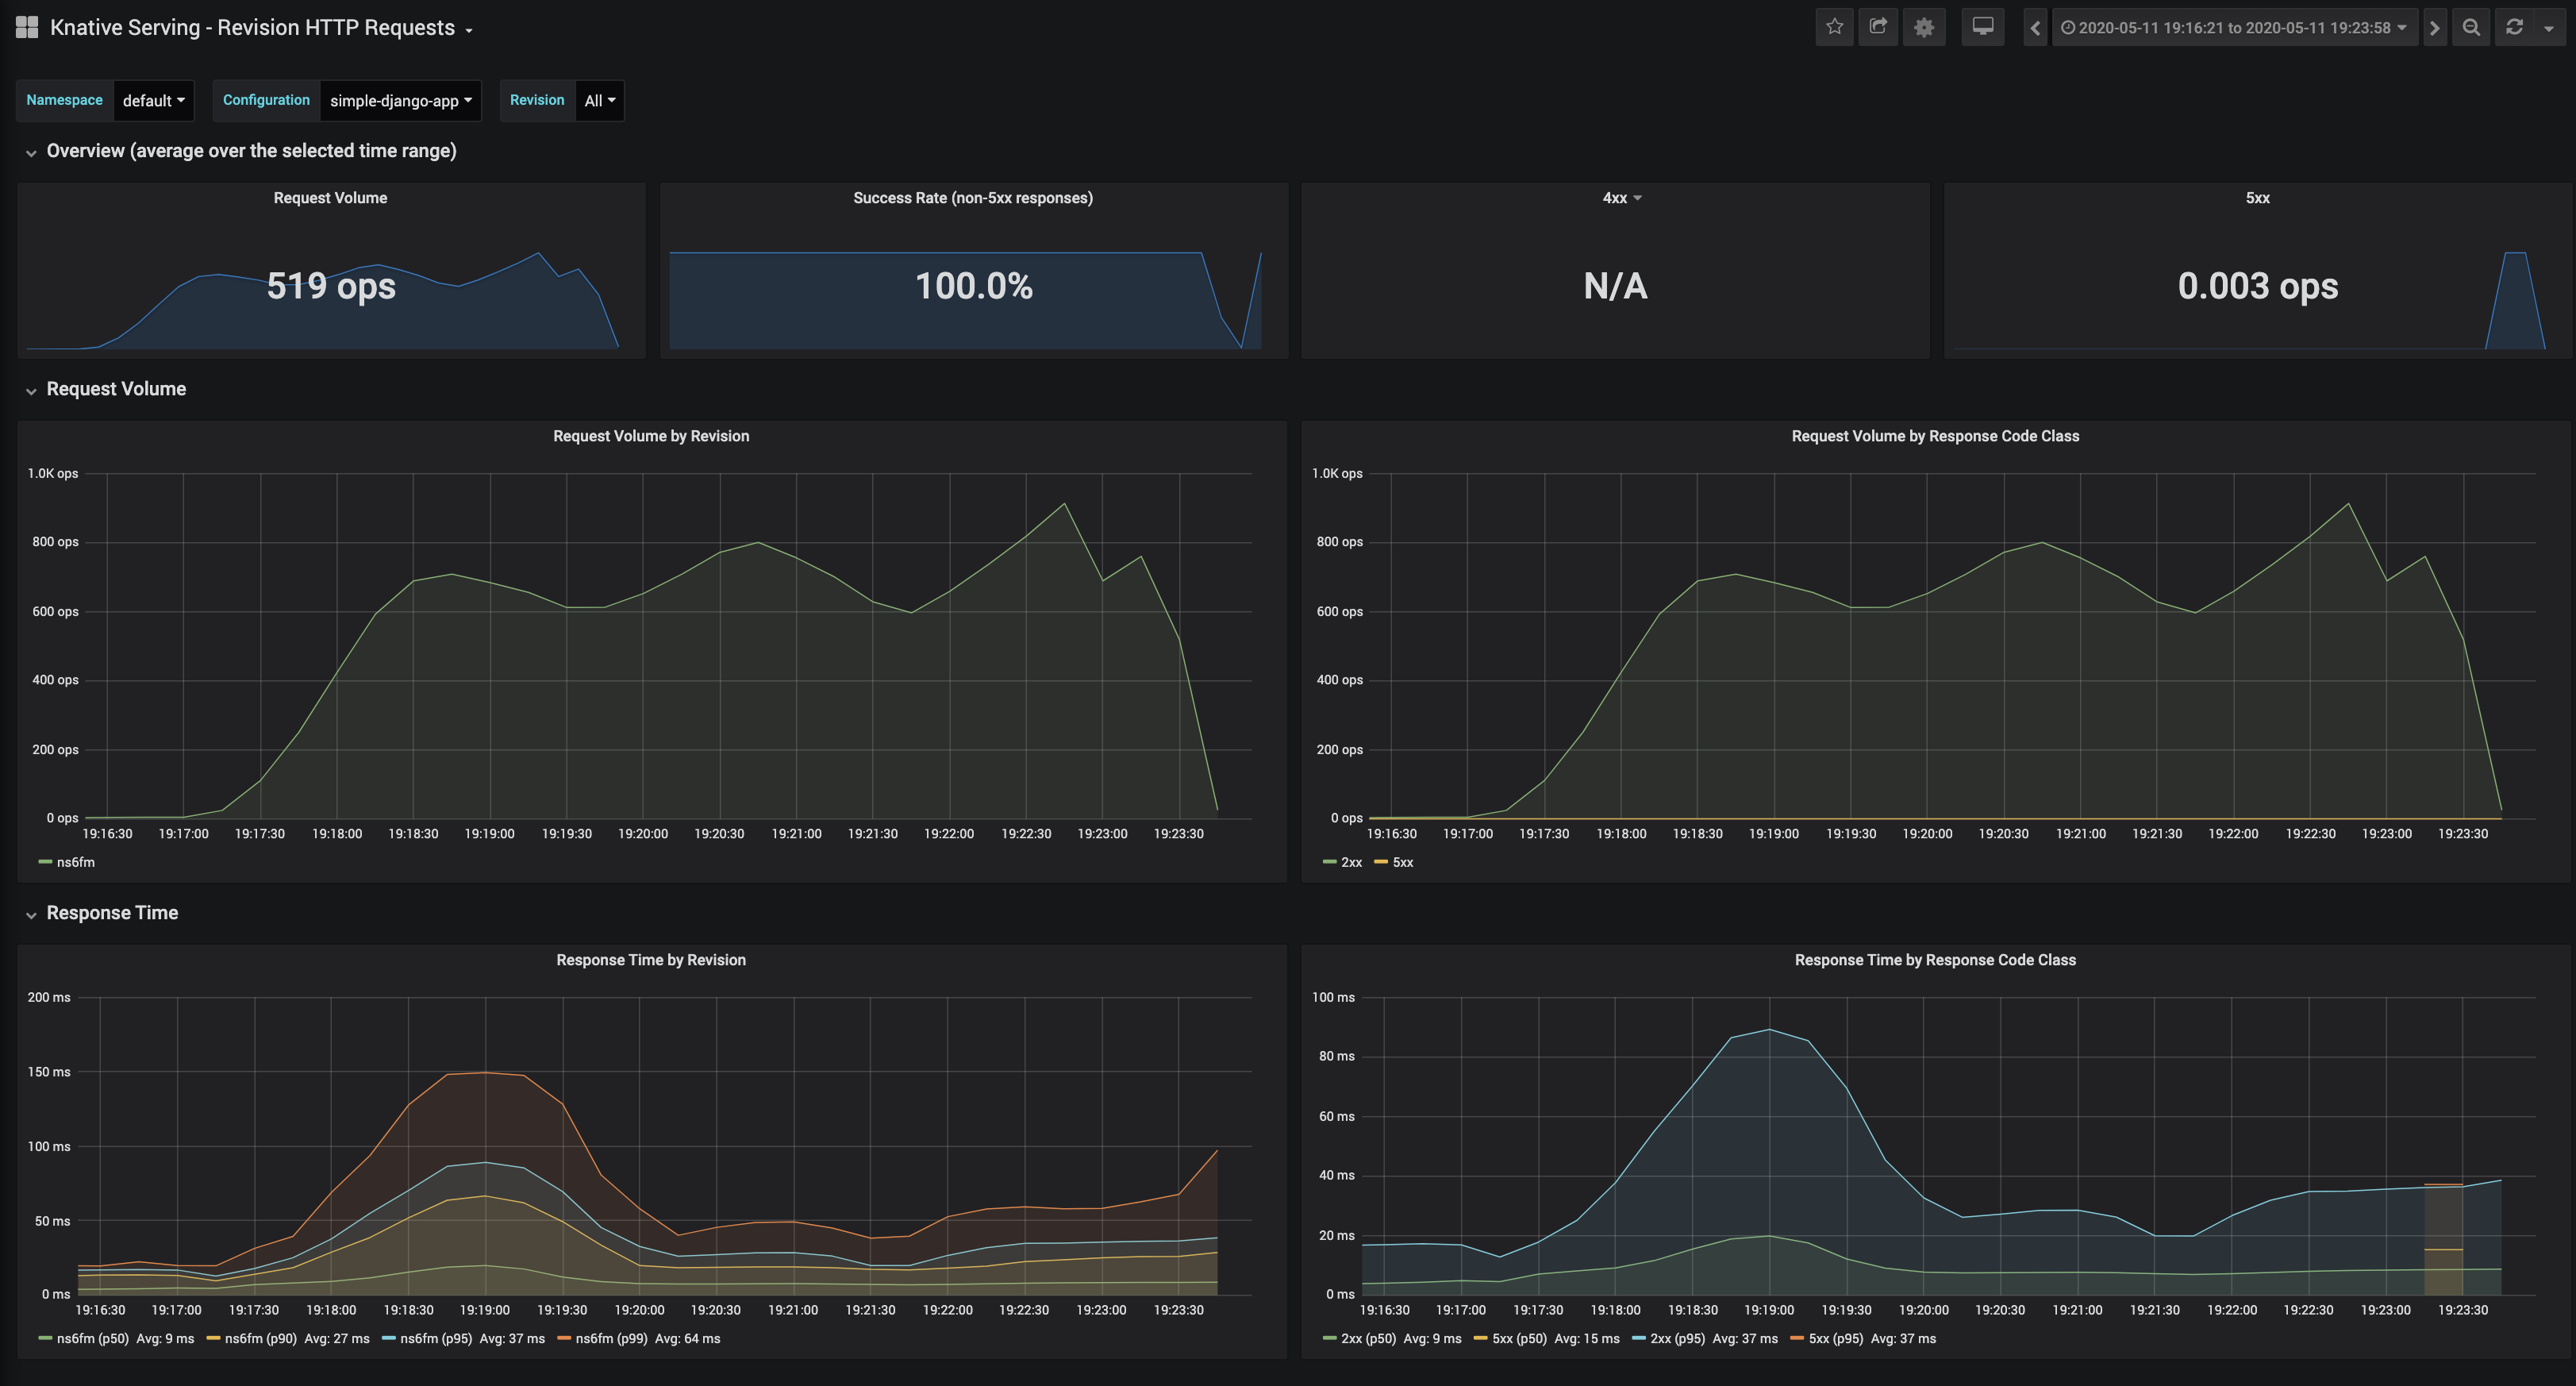
这些默认仪表板都很有趣,但是我发现最有用的是Knative Serving - Revision HTTP Requests,它可以描述当前正在运行的应用程序。
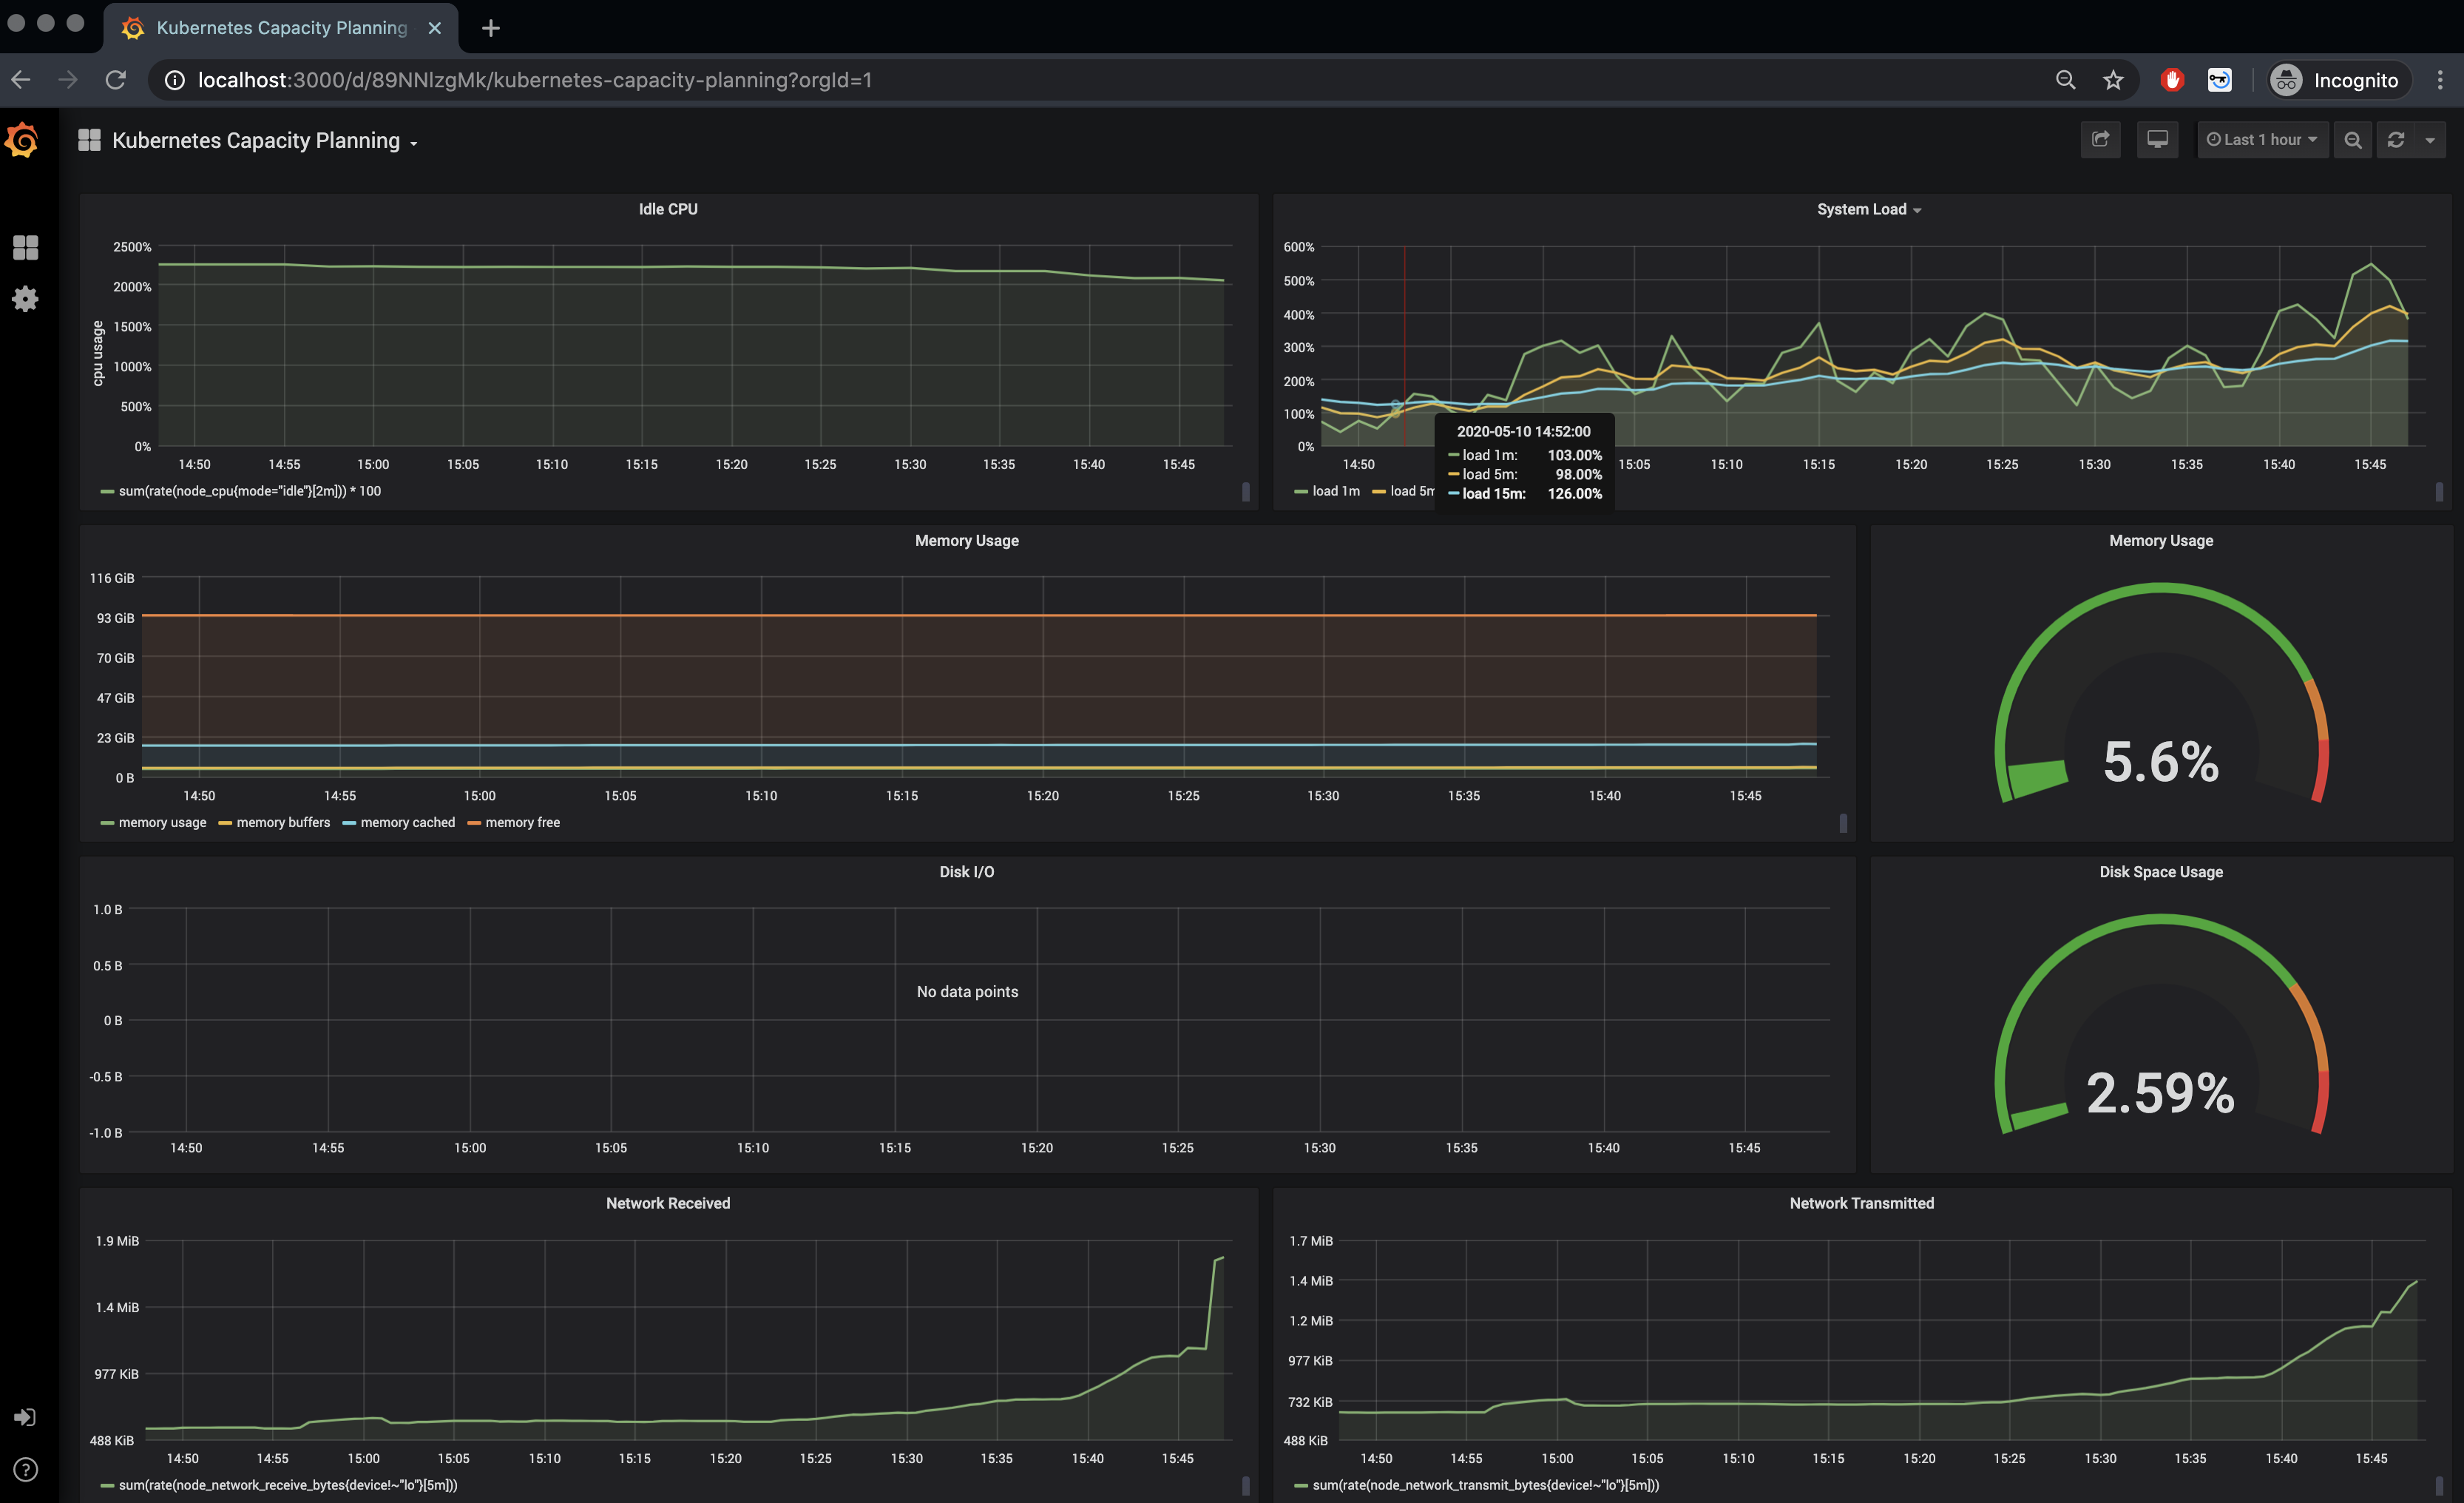
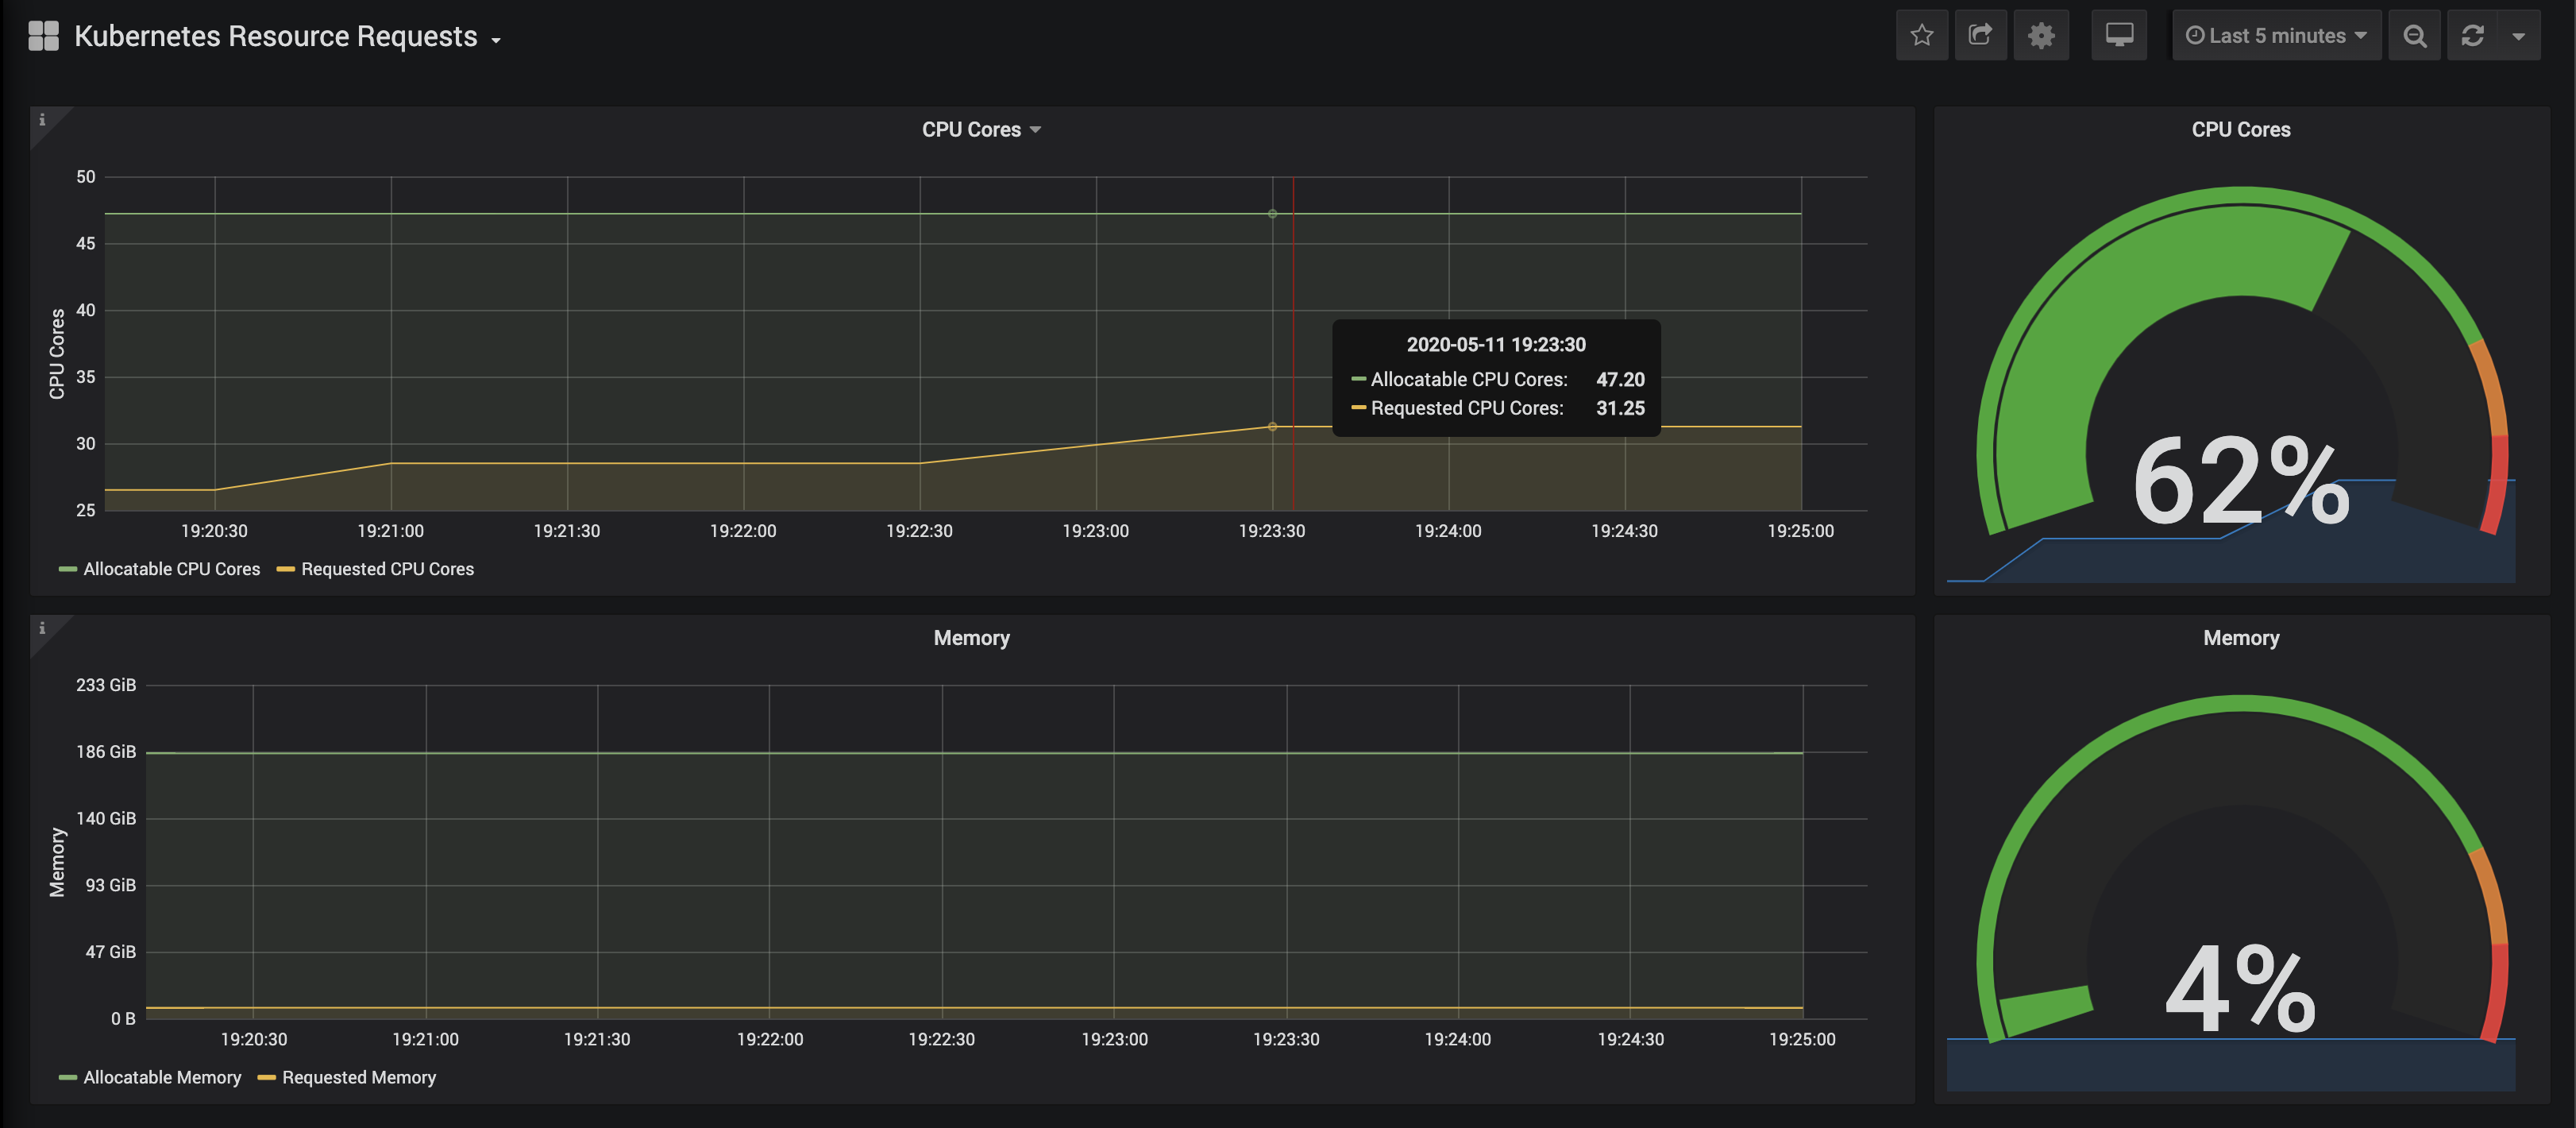
Kubernetes Capacity Planning 给出了集群的整体运行情况。
对于日志,我们需要配置 ElasticSearch 和 Kibana。我们需要编辑 config-observability ConfigMap,并将 logging.request-log-template 设置为
复制代码
╰─>$ kubectl edit cm config-observabilitylogging.request-log-template: '{"httpRequest": {"requestMethod": "{{.Request.Method}}", "requestUrl": "{{js .Request.RequestURI}}", "requestSize": "{{.Request.ContentLength}}", "status": {{.Response.Code}}, "responseSize": "{{.Response.Size}}", "userAgent": "{{js .Request.UserAgent}}", "remoteIp": "{{js .Request.RemoteAddr}}", "serverIp": "{{.Revision.PodIP}}", "referer": "{{js .Request.Referer}}", "latency": "{{.Response.Latency}}s", "protocol": "{{.Request.Proto}}"}, "traceId": "{{index .Request.Header "X-B3-Traceid"}}"}'接下来执行
复制代码
╰─>$ kubectl apply --filename https://storage.googleapis.com/knative-nightly/serving/latest/monitoring-logs-elasticsearch.yaml
我们将为节点设置 beta.kubernetes.io/fluentd-ds-ready="true"标签
复制代码
╰─>$ kubectl label nodes --all beta.kubernetes.io/fluentd-ds-ready="true"node/rabbit-1.vtemian.com labelednode/rabbit-2.vtemian.com labelednode/rabbit-3.vtemian.com labeled
并检查 fluentd 守护程序集是否在我们的节点上运行
复制代码
╰─>$ kubectl get daemonset fluentd-ds --namespace knative-monitoringNAME DESIRED CURRENT READY UP-TO-DATE AVAILABLE NODE SELECTOR AGEfluentd-ds 2 2 2 2 2 beta.kubernetes.io/fluentd-ds-ready=true 5m37s
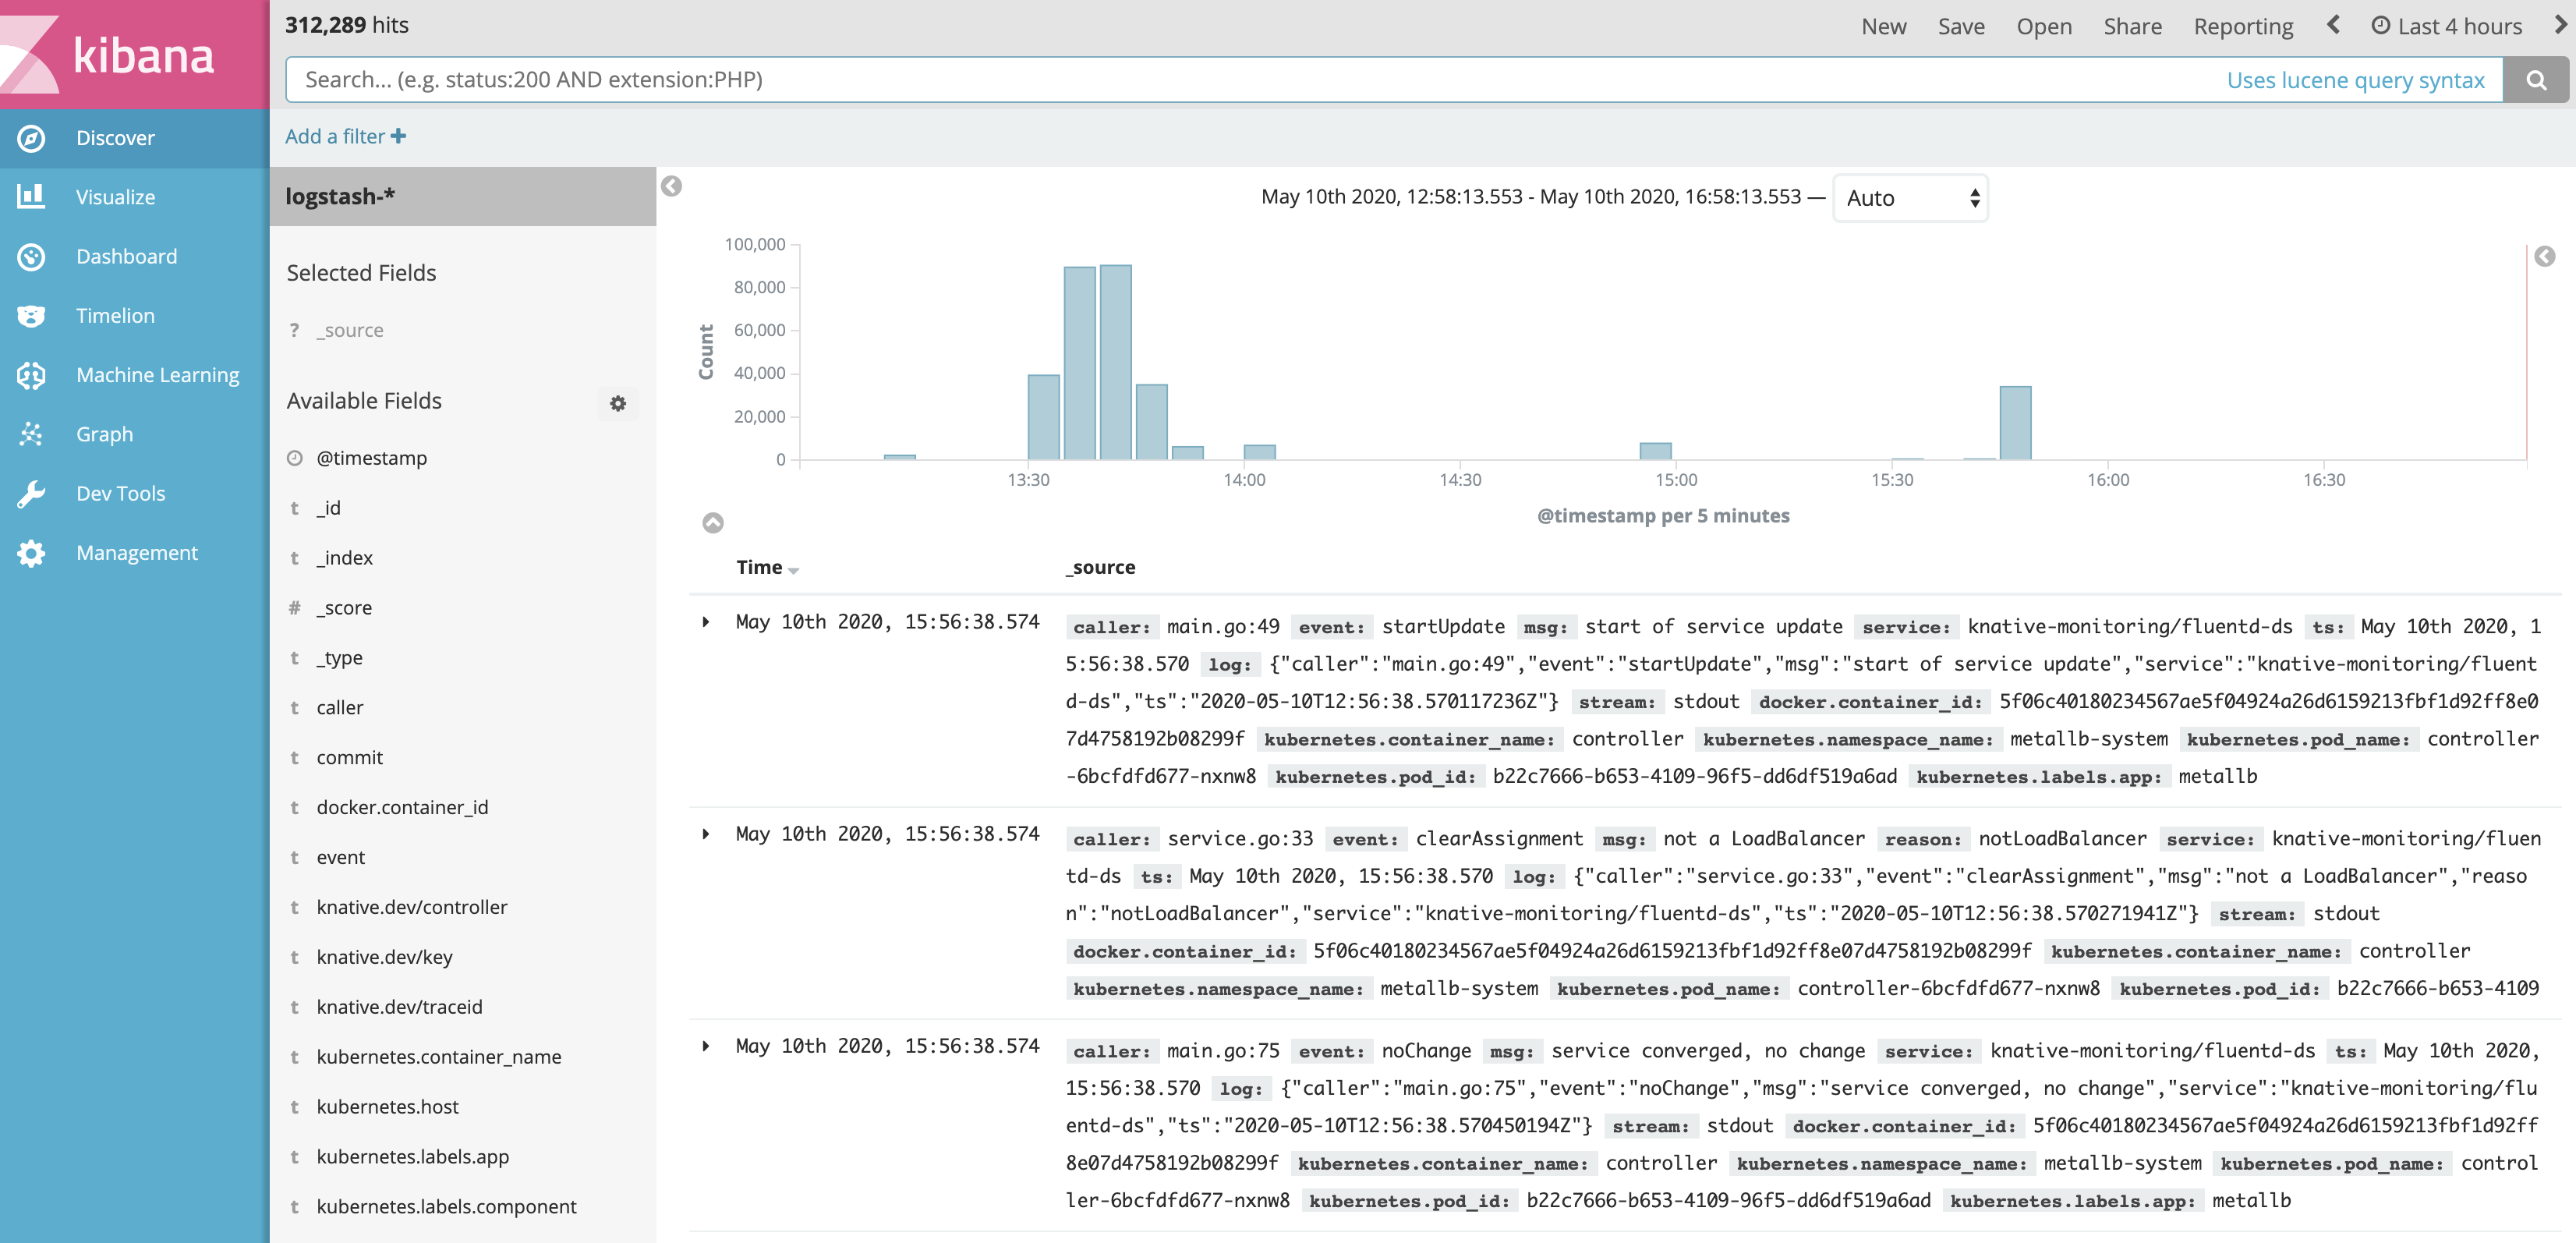
至此,在每个节点上,Fluentd 守护程序都运行正常,收集日志并将其发送到 ElasticSearch。 此外,我们需要配置 Kibana 来访问这些日志。
下面我们将启动本地代理
复制代码
╰─>$kubectl proxy
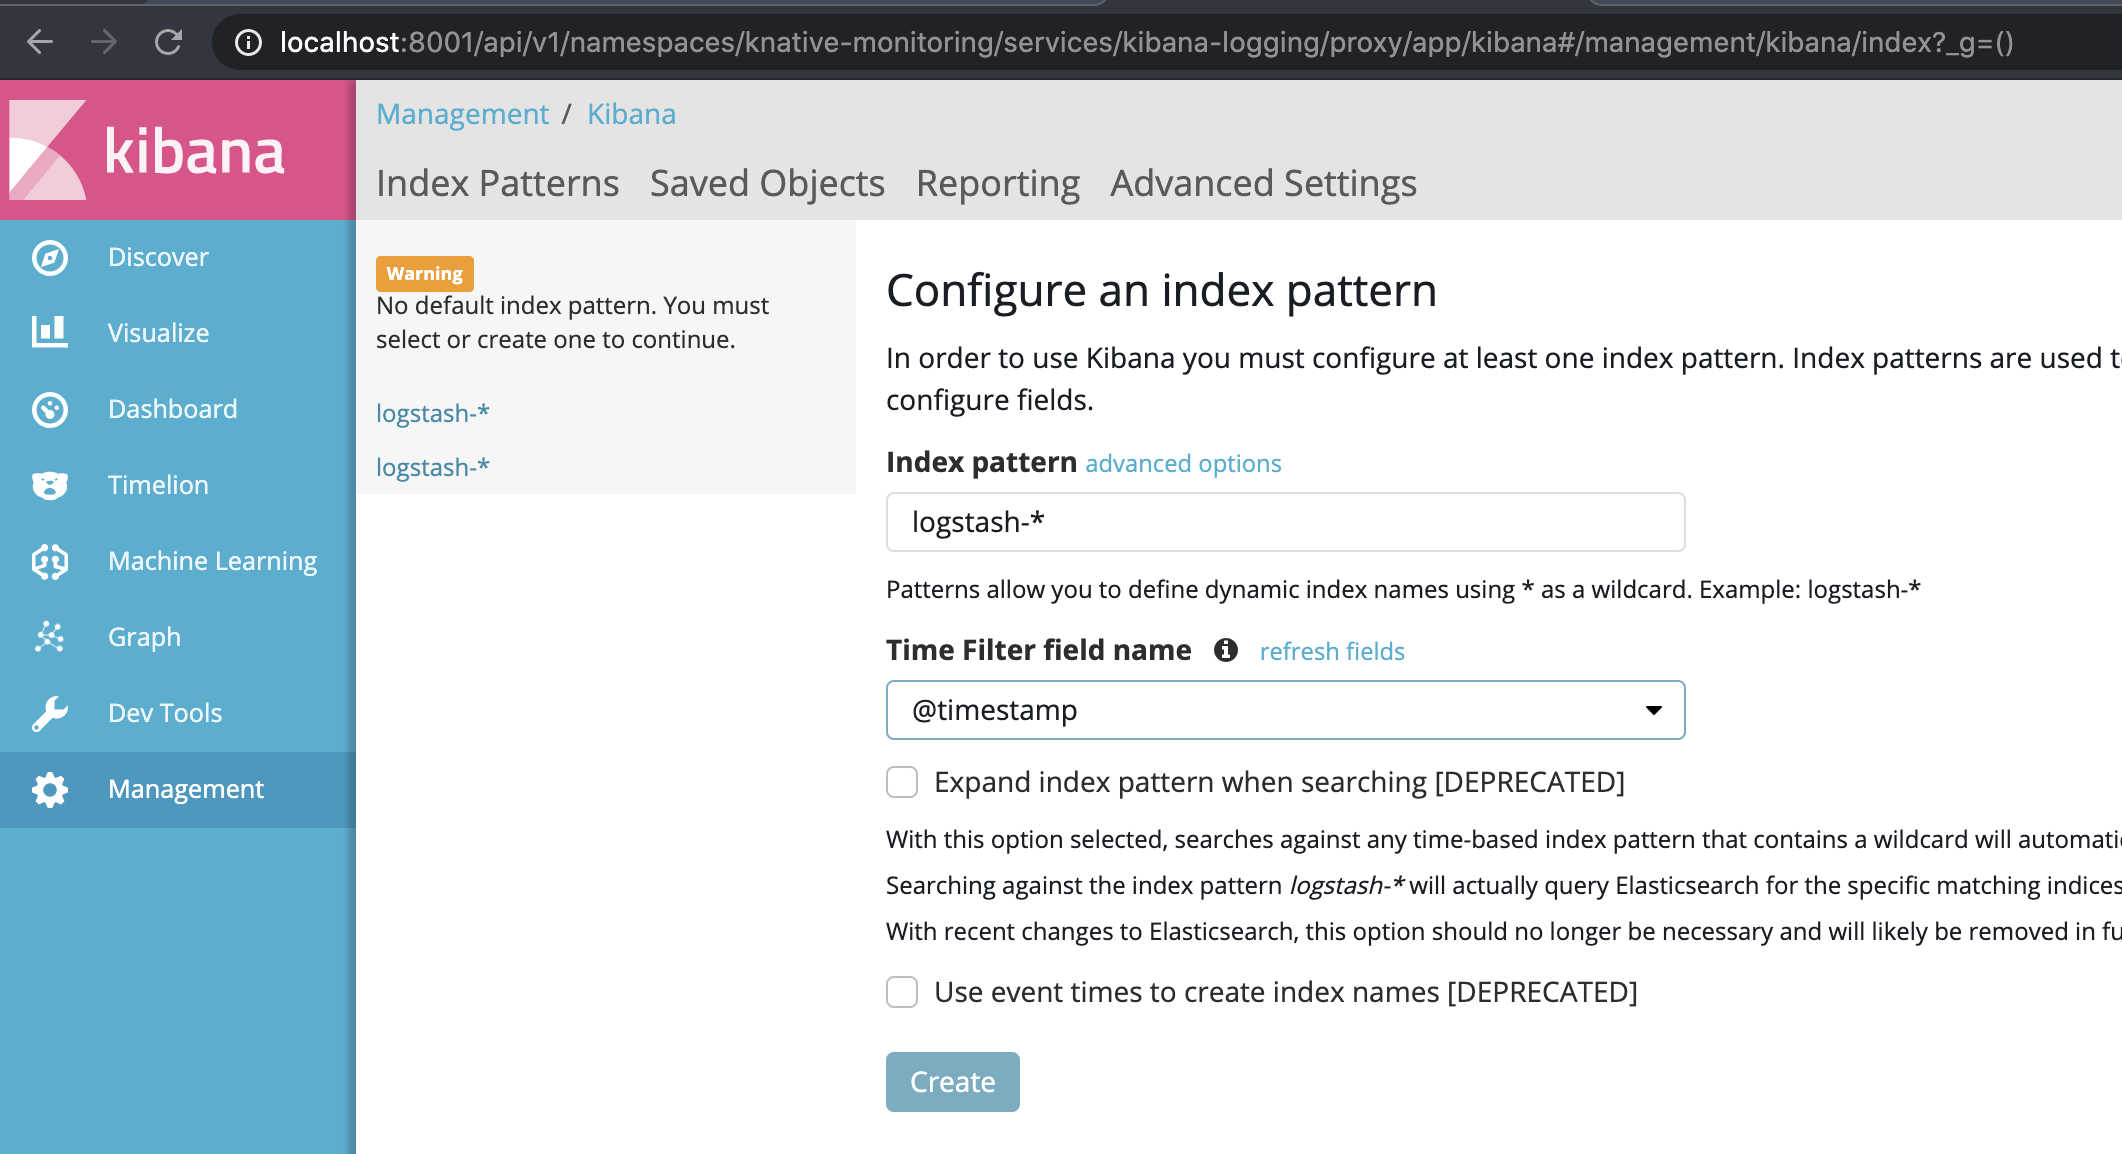
访问 Kibana UI 。如果服务没有启动,您可以使用以下配置创建一个
apiVersion: v1
kind: Service
metadata:
  name: kibana-logging
  namespace: knative-monitoring
  labels:
    app: kibana-logging
    kubernetes.io/cluster-service: "true"
    kubernetes.io/name: "Kibana"
spec:
  ports:
  - port: 5601
    protocol: TCP
    targetPort: ui
  selector:
    app: kibana-logging
创建一个新索引,然后等待索引处理完成。
然后将其设置为默认索引
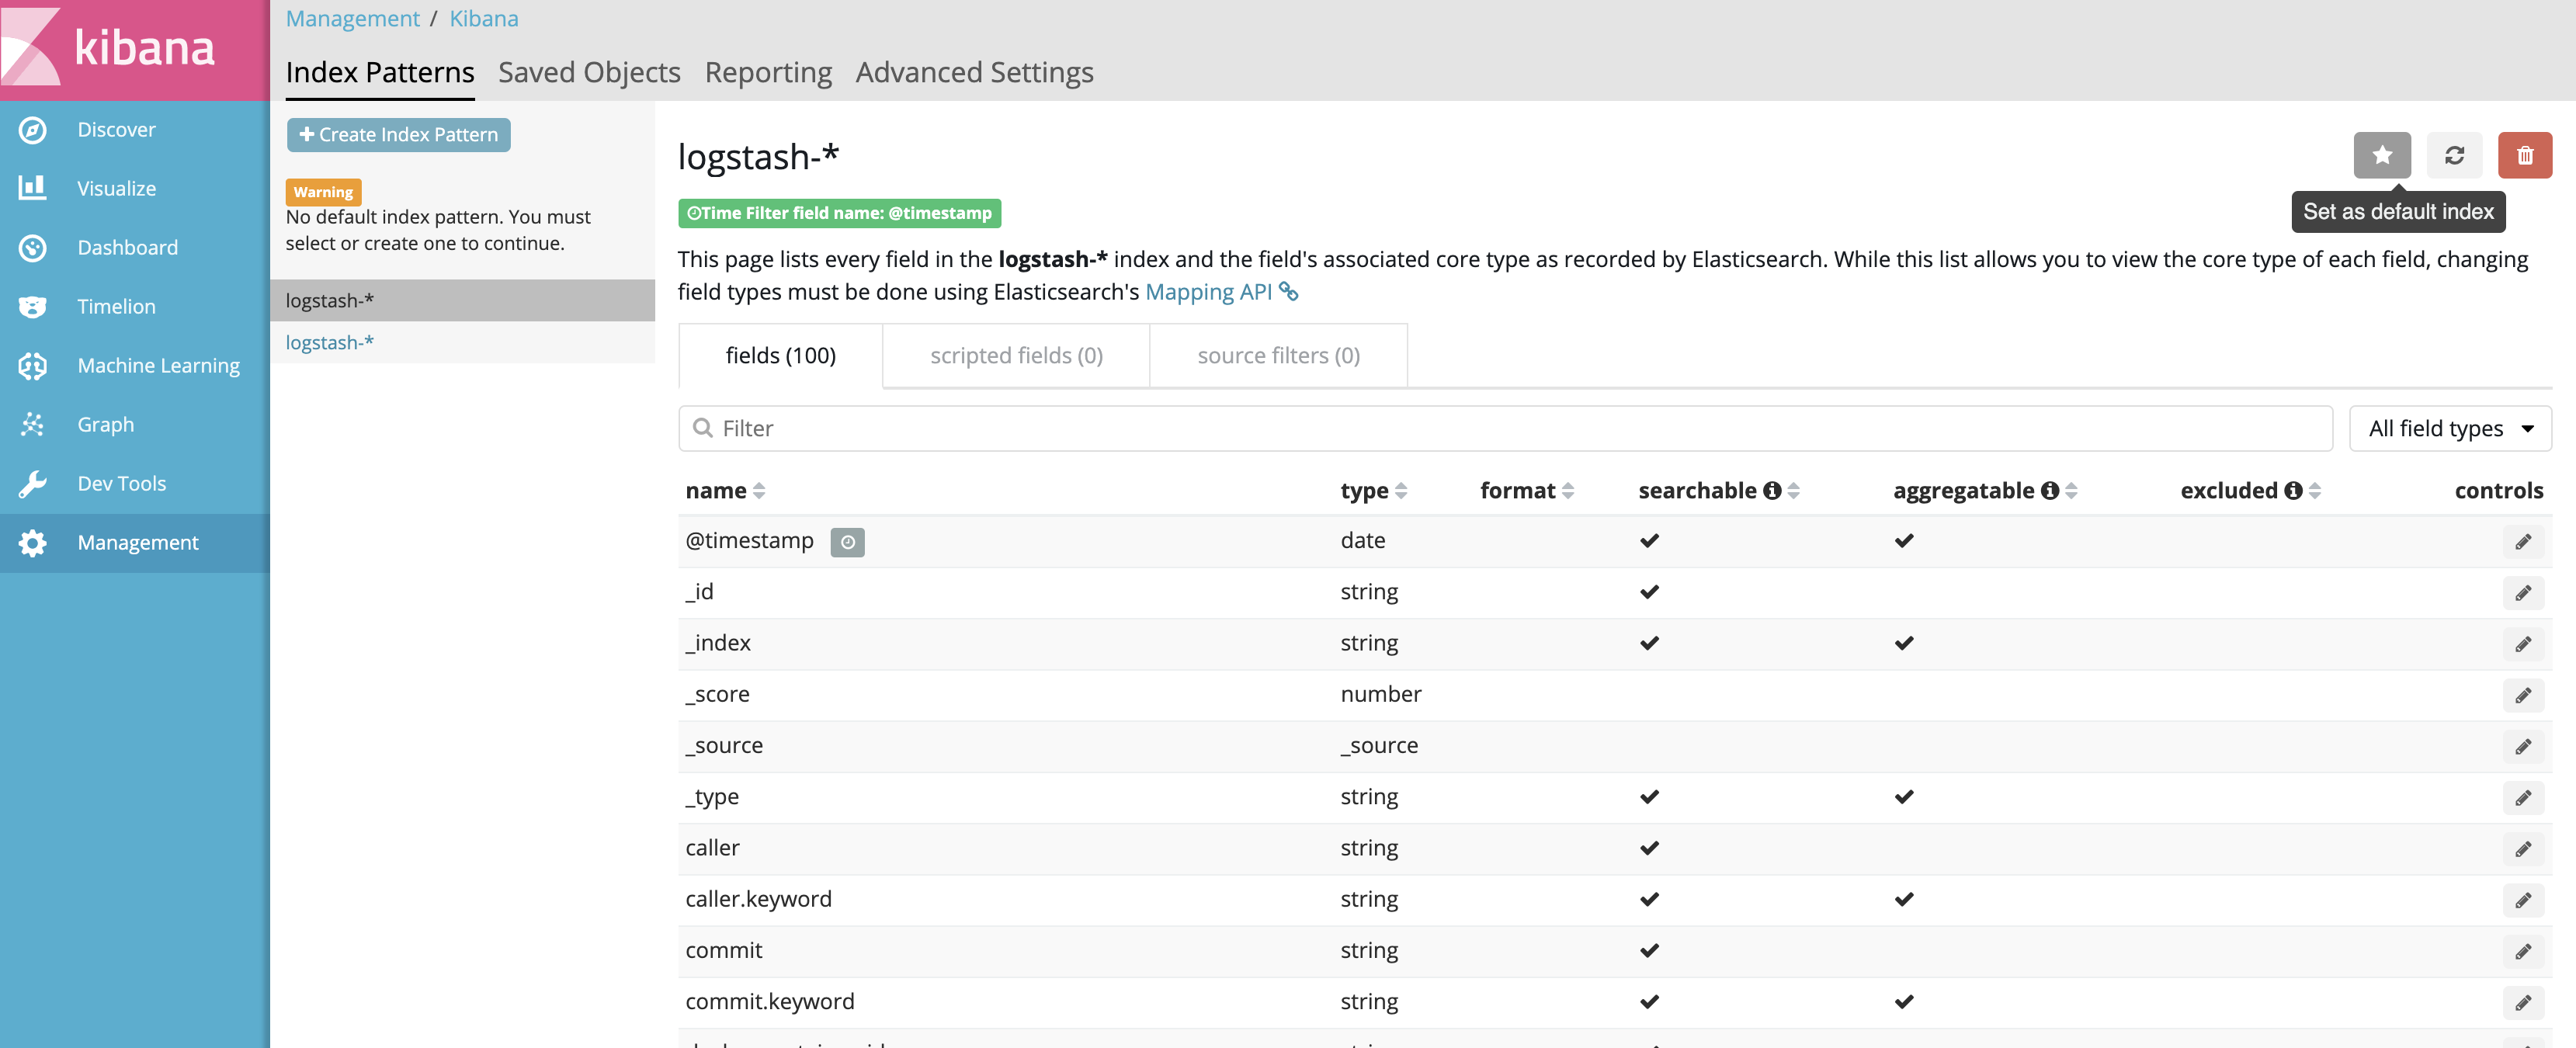
现在日志流应该可以展示出来了
Autoscaling
现在,我们可以真正看到集群中发生的事情了,我们来配置自动缩放和 0 缩放。 为此,我们需要编辑 config-autoscaler 配置。注释中已经描述了所有选项配置,出于测试目的,下面是我正在使用的配置:
  activator-capacity: "100.0"
  container-concurrency-target-default: "100"
  container-concurrency-target-percentage: "70"
  enable-graceful-scaledown: "true"
  enable-scale-to-zero: "true"
  max-scale-down-rate: "2.0"
  max-scale-up-rate: "1000.0"
  panic-threshold-percentage: "20.0"
  panic-window-percentage: "5.0"
  pod-autoscaler-class: kpa.autoscaling.knative.dev
  requests-per-second-target-default: "20"
  scale-to-zero-grace-period: 30s
  stable-window: 60s
  target-burst-capacity: "10"
  tick-interval: 2s
所有这些选项已在文档中进行了说明,但也许我们最感兴趣的是 0 缩放
复制代码
接着配置并发请求默认数
复制代码
这些是应用于每个修订版的配置,但是你可以使用注解独立控制。我们将 Horizontal Pod Autoscaler 配置为遵循 CPU 指标并在 CPU 使用率为限制的 30%时进行缩放。
apiVersion: serving.knative.dev/v1
kind: Service
metadata:
  name: simple-django-app
  namespace: default
spec:
  template:
    metadata:
      annotations:
        autoscaling.knative.dev/metric: cpu
        autoscaling.knative.dev/target: "70"
        autoscaling.knative.dev/class: hpa.autoscaling.knative.dev
    spec:
      containers:
      - image: docker.io/vtemian/simple-django-app
        resources:
          requests:
            cpu: 100m
后台启动一个 curl 查看
复制代码
╰─>$ watch -n 0.1 curl -SI http://simple-django-app.default.147.75.80.160.xip.io/polls/
发现有两个正在运行的容器
复制代码
╰─>$ kubectl get po -l serving.knative.dev/service=simple-django-appNAME READY STATUS RESTARTS AGEsimple-django-app-g9zf5-deployment-5b76fdf7fc-mtlwt 2/2 Running 0 3m25ssimple-django-app-mg96q-deployment-7db5bb6b9c-29ffw 2/2 Running 0 4m18s
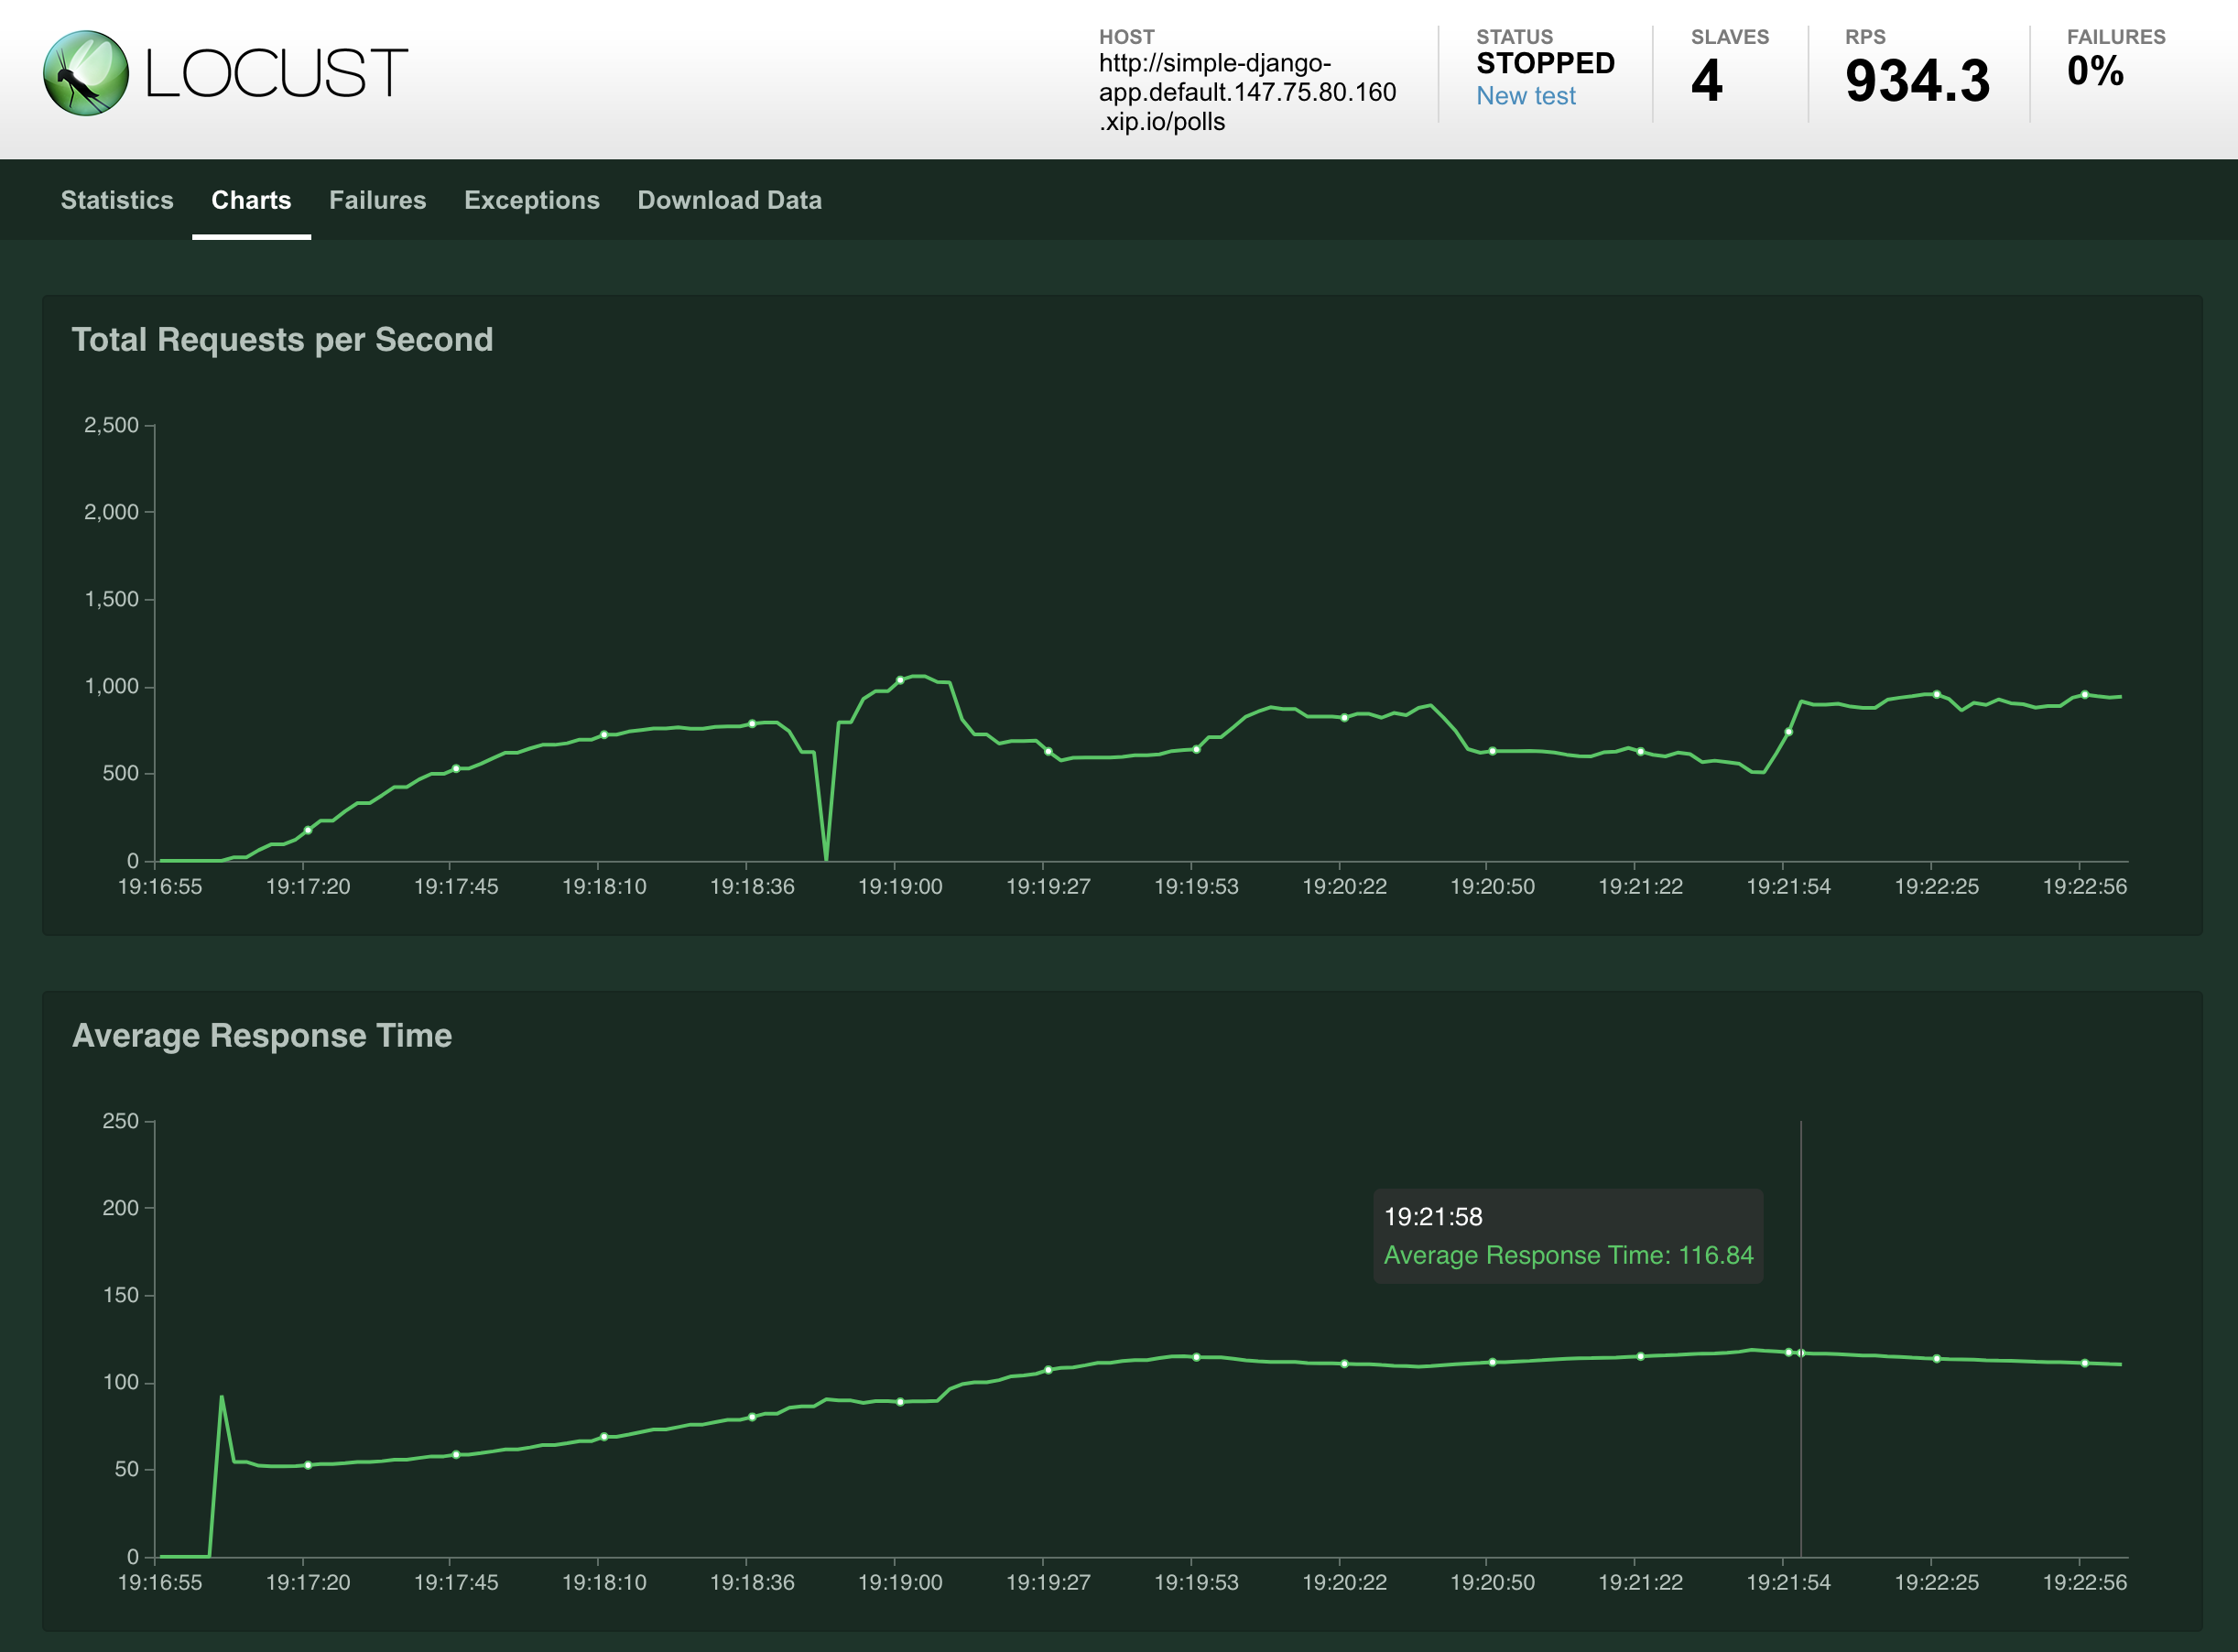
更进一步,我们开始 Locust 测试。我们将按照 zalando-incubator 的指示进行操作,并开始提供可用于我们服务的副本:
复制代码
_________________________________________________________________________________L O C A L - D E P L O Y M E N T_________________________________________________________________________________Target url: http://simple-django-app.default.147.75.80.160.xip.io/pollsWhere load test script is stored (e.g. https://raw.githubusercontent.com/zalando-incubator/docker-locust/master/example/simple.py): https://raw.githubusercontent.com/zalando-incubator/docker-locust/master/example/simple.pyNumber of slave(s): 4Run type [automatic/manual]: manual----------------------------------------------VARIABLES----------------------------------------------TARGET_URL: http://simple-django-app.default.147.75.80.160.xip.io/pollsLOCUST_FILE: https://raw.githubusercontent.com/zalando-incubator/docker-locust/master/example/simple.pySLAVES NUMBER: 4RUN_TYPE: manual || automatic=falseNUMBER OF USERS:HATCH_RATE:DURATION [in seconds]:COMPOSE: falseSEND_ANONYMOUS_USAGE_INFO: true----------------------------------------------
运行结果很酷炫
复制代码
╰─>$ kubectl get po -l serving.knative.dev/service=simple-django-appNAME READY STATUS RESTARTS AGEsimple-django-app-ns6fm-deployment-85cff985d5-249rj 2/2 Running 0 41ssimple-django-app-ns6fm-deployment-85cff985d5-2c6m9 2/2 Running 0 41ssimple-django-app-ns6fm-deployment-85cff985d5-2m6kk 2/2 Running 0 86ssimple-django-app-ns6fm-deployment-85cff985d5-2mm7t 2/2 Running 0 41ssimple-django-app-ns6fm-deployment-85cff985d5-2q7f8 2/2 Running 0 41ssimple-django-app-ns6fm-deployment-85cff985d5-5xcxf 2/2 Running 0 71ssimple-django-app-ns6fm-deployment-85cff985d5-6jxfw 2/2 Running 0 41ssimple-django-app-ns6fm-deployment-85cff985d5-77v6w 2/2 Running 0 41ssimple-django-app-ns6fm-deployment-85cff985d5-8qk5s 2/2 Running 0 56ssimple-django-app-ns6fm-deployment-85cff985d5-9n4h6 2/2 Running 0 41ssimple-django-app-ns6fm-deployment-85cff985d5-b466k 2/2 Running 0 7m57ssimple-django-app-ns6fm-deployment-85cff985d5-b8qbf 2/2 Running 0 25ssimple-django-app-ns6fm-deployment-85cff985d5-bkt66 2/2 Running 0 71ssimple-django-app-ns6fm-deployment-85cff985d5-bxbzf 2/2 Running 0 56ssimple-django-app-ns6fm-deployment-85cff985d5-d5xt5 2/2 Running 0 41ssimple-django-app-ns6fm-deployment-85cff985d5-jrchv 2/2 Running 0 41ssimple-django-app-ns6fm-deployment-85cff985d5-mtrvh 2/2 Running 0 56ssimple-django-app-ns6fm-deployment-85cff985d5-mzz7g 2/2 Running 0 41ssimple-django-app-ns6fm-deployment-85cff985d5-p7wvx 2/2 Running 0 41ssimple-django-app-ns6fm-deployment-85cff985d5-pbmzb 2/2 Running 0 25ssimple-django-app-ns6fm-deployment-85cff985d5-pzb92 2/2 Running 0 56ssimple-django-app-ns6fm-deployment-85cff985d5-pzkrr 2/2 Running 0 41ssimple-django-app-ns6fm-deployment-85cff985d5-qhjxq 2/2 Running 0 41ssimple-django-app-ns6fm-deployment-85cff985d5-rc2xx 2/2 Running 0 41ssimple-django-app-ns6fm-deployment-85cff985d5-s7lzm 2/2 Running 0 25ssimple-django-app-ns6fm-deployment-85cff985d5-sdpmf 2/2 Running 0 41ssimple-django-app-ns6fm-deployment-85cff985d5-ss66c 2/2 Running 0 6m27ssimple-django-app-ns6fm-deployment-85cff985d5-ssrzg 2/2 Running 0 56ssimple-django-app-ns6fm-deployment-85cff985d5-t424m 2/2 Running 0 56ssimple-django-app-ns6fm-deployment-85cff985d5-tjlsz 2/2 Running 0 71ssimple-django-app-ns6fm-deployment-85cff985d5-tzcjw 2/2 Running 0 56ssimple-django-app-ns6fm-deployment-85cff985d5-w2tsp 2/2 Running 0 71ssimple-django-app-ns6fm-deployment-85cff985d5-x9626 2/2 Running 0 41ssimple-django-app-ns6fm-deployment-85cff985d5-xm5pk 2/2 Running 0 86ssimple-django-app-ns6fm-deployment-85cff985d5-xv9sw 2/2 Running 0 56s
监控到的请求响应结果以及资源使用情况如下
目前,我们有一个运行的 Kubernetes 集群,该集群通过 Packet 构建在裸机上,具有 3 个节点,一个正在运行的 Knative,用于服务和扩展 Docker 映像。
Mysql
最后,让我们为这个安装添加一些状态。在我目前正在工作的公司 Presslabs ,我们为 MySQL 构建了一个控制器。 它负责复制、备份和其他繁琐的操作。 它的安装及其配置相当简单,但是首先,我们需要配置一些持久卷:
复制代码
apiVersion: v1kind: PersistentVolumemetadata:labels:type: localname: rabbit-1.vtemian.comspec:accessModes:- ReadWriteOncecapacity:storage: 11GihostPath:path: /mnt/datatype: ""nodeAffinity:required:nodeSelectorTerms:- matchExpressions:- key: kubernetes.io/hostnameoperator: Invalues:- rabbit-1.vtemian.compersistentVolumeReclaimPolicy: RetainstorageClassName: standardvolumeMode: Filesystem
我们为每个节点创建一个持久卷并查看:
复制代码
╰─>$ kubectl get pvNAME CAPACITY ACCESS MODES RECLAIM POLICY STATUS CLAIM STORAGECLASS REASON AGErabbit-1.vtemian.com 11Gi RWO Retain Available standard 2m58srabbit-2.vtemian.com 11Gi RWO Retain Bound default/data-mysql-operator-0 standard 3m9srabbit-3.vtemian.com 11Gi RWO Retain Available standard 3m19s
现在,我们可以继续使用 mysql-operator:
复制代码
╰─>$ helm repo add presslabs https://presslabs.github.io/charts╰─>$ helm install presslabs/mysql-operator --name mysql-operator --set orchestrator.persistence.storageClass=standard
此外,我们需要一个密码,它包含我们想要用于 mysql 集群的凭据。
复制代码
apiVersion: v1kind: Secretmetadata:name: my-secrettype: Opaquedata:ROOT_PASSWORD: bXlwYXNzDATABASE: cmFiYml0Cg==USER: cmFiYml0Cg==PASSWORD: bXlwYXNz
为该集群配置两个副本
复制代码
apiVersion: mysql.presslabs.org/v1alpha1kind: MysqlClustermetadata:name: my-clusterspec:replicas: 2secretName: my-secret
现在我们有两个副本:
复制代码
╰─>$ kubectl get po -l app.kubernetes.io/name=mysqlNAME READY STATUS RESTARTS AGEmy-cluster-mysql-0 4/4 Running 0 3m11smy-cluster-mysql-1 4/4 Running 0 4m37s
查看服务如下:
复制代码
╰─>$ kubectl get service -l app.kubernetes.io/name=mysqlNAME TYPE CLUSTER-IP EXTERNAL-IP PORT(S) AGEmy-cluster-mysql ClusterIP 10.233.50.17 <none> 3306/TCP 10mmy-cluster-mysql-master ClusterIP 10.233.29.255 <none> 3306/TCP 10m
此时,服务组件已启动并正常运行,并已通过虚拟应用程序进行了测试。让我们进一步探讨构建组件。
CI/CD
Tekton
Knative 以前有一个构建组件,现在已不推荐使用,而是首推 Tekton 。关于如何配置 Tekton 并将其与 Knative 集成,有一些不错的使用文档,但首先得安装它:
复制代码
╰─>$ kubectl apply --filename https://storage.googleapis.com/tekton-releases/pipeline/latest/release.yaml
最后,我们只需要编辑 config-artifact-pvc 配置,以允许 Tekton 将 artifacts 保存在 PVC 中。
复制代码
data:size: 5GistorageClassName: default
看一下 Tekton 容器的运行情况,我们可以看到它运行正常:
复制代码
╰─>$ kubectl get po -n tekton-pipelinesNAME READY STATUS RESTARTS AGEtekton-pipelines-controller-5c44bcfc44-gfhdx 1/1 Running 0 85mtekton-pipelines-webhook-7bd568f6c6-vll6v 1/1 Running 0 85m
How does Tekton work?
在建立 pipeline 之前,让我们先探讨一下 Tekton。Tekton 利用 CRDs 并允许我们通过定义 Kubernetes 资源来描述 pipeline。 我将从该指南及其官方文档进行说明。
任务是用于定义实际工作单元的模板。就像定义一个函数及其参数和行为一样。它定义一个或多个步骤,并在每个步骤中执行一个容器。 可以参考来自 https://github.com/knative-sample/tekton-knative 的示例。
复制代码
apiVersion: tekton.dev/v1alpha1kind: Taskmetadata:name: deploy-using-kubectlspec:inputs:resources:- name: git-sourcetype: gitparams:- name: pathToYamlFiledescription: The path to the yaml file to deploy within the git source- name: imageUrldescription: Url of image repository- name: imageTagdescription: Tag of the images to be used.default: "latest"steps:- name: update-yamlimage: alpinecommand: ["sed"]args:- "-i"- "-e"- "s;__IMAGE__;${inputs.params.imageUrl}:${inputs.params.imageTag};g"- "/workspace/git-source/${inputs.params.pathToYamlFile}"- name: run-kubectlimage: registry.cn-hangzhou.aliyuncs.com/knative-sample/kubectl:v0.5.0command: ["kubectl"]args:- "apply"- "-f"- "/workspace/git-source/${inputs.params.pathToYamlFile}"TaskRun 是 Task 的运行实例。 它按顺序执行任务的所有步骤,直到所有步骤完成为止。 参考来自 https://github.com/knative-sample/tekton-knative 的示例。
复制代码
apiVersion: tekton.dev/v1alpha1kind: TaskRunmetadata:name: source-to-imagespec:taskRef:name: source-to-imageparams:- name: pathToContextvalue: "${params.pathToContext}"- name: imageUrlvalue: "${params.imageUrl}"- name: imageTagvalue: "${params.imageTag}"resources:inputs:- name: git-sourceresource: git-source管道允许我们定义多个任务。 使用TaskRun,我们只能运行一个任务。 管道中的每个任务都作为容器执行。 参考来自 https://github.com/knative-sample/tekton-knative 示例
复制代码
apiVersion: tekton.dev/v1alpha1kind: Pipelinemetadata:name: build-and-deploy-pipelinespec:resources:- name: git-sourcetype: gitparams:- name: pathToContextdescription: The path to the build context, used by Kaniko - within the workspacedefault: src- name: pathToYamlFiledescription: The path to the yaml file to deploy within the git source- name: imageUrldescription: Url of image repository- name: imageTagdescription: Tag to apply to the built imagetasks:- name: source-to-imagetaskRef:name: source-to-imageparams:- name: pathToContextvalue: "${params.pathToContext}"- name: imageUrlvalue: "${params.imageUrl}"- name: imageTagvalue: "${params.imageTag}"resources:inputs:- name: git-sourceresource: git-source- name: deploy-to-clustertaskRef:name: deploy-using-kubectlrunAfter:- source-to-imageparams:- name: pathToYamlFilevalue: "${params.pathToYamlFile}"- name: imageUrlvalue: "${params.imageUrl}"- name: imageTagvalue: "${params.imageTag}"resources:inputs:- name: git-sourceresource: git-source与 TaskRun 类似, PipelineRun 执行管道中定义的所有任务。 参考来自 https://github.com/knative-sample/tekton-knative 示例。
复制代码
apiVersion: tekton.dev/v1alpha1kind: PipelineRunmetadata:generateName: tekton-kn-sample-spec:pipelineRef:name: build-and-deploy-pipelineresources:- name: git-sourceresourceRef:name: tekton-knative-gitparams:- name: pathToContextvalue: "src"- name: pathToYamlFilevalue: "knative/helloworld-go.yaml"- name: imageUrlvalue: "registry.cn-hangzhou.aliyuncs.com/knative-sample/tekton-knative-helloworld"- name: imageTagvalue: "1.0"trigger:type: manualserviceAccount: pipeline-account
PipelineResources 允许我们定义任务的输入和输出所使用的对象。 参考来自 https://github.com/knative-sample/tekton-knative 示例
复制代码
apiVersion: tekton.dev/v1alpha1kind: PipelineResourcemetadata:name: tekton-knative-gitspec:type: gitparams:- name: revisionvalue: master- name: urlvalue: https://github.com/knative-sample/tekton-knative
Pipeline setup
以上这些都是我们要使用的所有主要组件。
让我们创建一个名为ci的新名称空间,并安装上面的清单以满足我们的需求。 我已在示例应用中提交了更改。
复制代码
╰─>$ kubectl get poNAME READY STATUS RESTARTS AGEtekton-simple-django-app-1-deploy-to-cluster-982xv-pod-kkmpw 0/3 Completed 0 3m18stekton-simple-django-app-1-source-to-image-8c47t-pod-ccc44 0/3 Completed 0 3m44s
复制代码
╰─>$ kubectl get pipelinerunNAME SUCCEEDED REASON STARTTIME COMPLETIONTIMEtekton-simple-django-app-1 True Succeeded 2m14s 95s
Github webhook trigger
现在,我们必须通过删除并重新创建Pipelinerun来手动触发构建。让我们尝试通过配置一个 Github Webhook 使其自动化,该 Webhook 在每次进行新提交时都会触发一次构建过程。
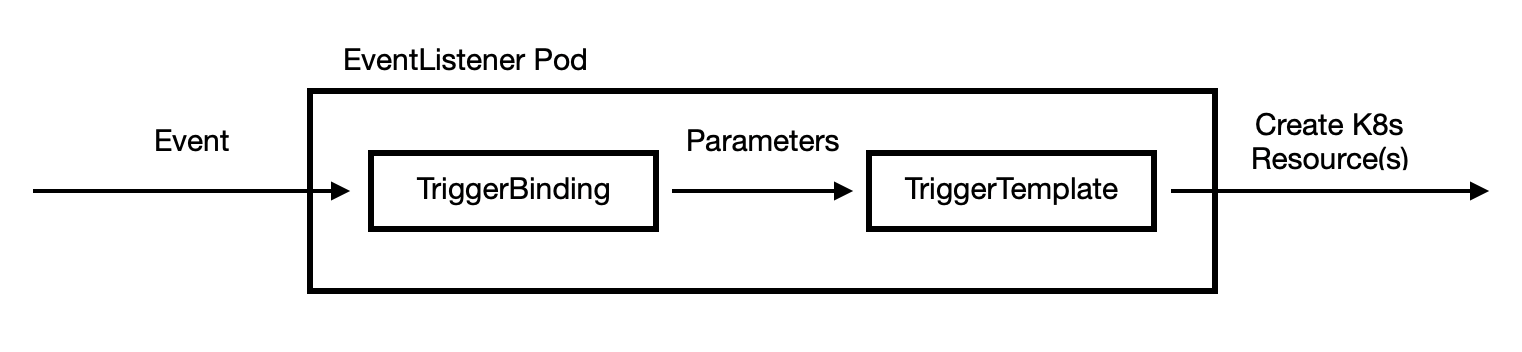
设置过程并不复杂,但也不简单。当 github hook 产生触发时,该触发会落入一个 事件监听器 容器(通过Istio 公开到Internet)。我们需要从payload 中提取相关参数,例如提交信息。为此,我们将使用 TriggerBindings 。然后, TriggerTemplate 使用这些参数来生成我们的 pipeline 来运行。 以下配置参考了 @ nikhilthomas1 。
我们为此过程创建一个角色,服务帐户和角色绑定。
复制代码
---apiVersion: rbac.authorization.k8s.io/v1kind: Rolerules:- apiGroups:- triggers.tekton.devresources:- eventlisteners- triggerbindings- triggertemplates- pipelineresourcesverbs:- get- apiGroups:- triggers.tekton.devresources:- pipelineruns- pipelineresourcesverbs:- create- apiGroups:- ""resources:- configmapsverbs:- get- list- create- update- delete---apiVersion: v1kind: ServiceAccountmetadata:name: tekton-triggers-sa---apiVersion: rbac.authorization.k8s.io/v1kind: RoleBindingmetadata:name: tekton-triggers-rolebindingsubjects:- kind: ServiceAccountname: tekton-triggers-saroleRef:apiGroup: rbac.authorization.k8s.iokind: Rolename: tekton-triggers-role⏎
TriggerTemplate 非常基础。它描述了绑定中可以使用的一些参数,并将它们与 PipelineRun 和其他资源打包在一起:
复制代码
apiVersion: triggers.tekton.dev/v1alpha1kind: TriggerTemplatemetadata:name: tekton-triggertemplatespec:params:- name: gitrevisiondescription: The git revisiondefault: master- name: gitrepositoryurldescription: The git repository url- name: namespacedescription: The namespace to create the resources- name: gitrepositorynamedescription: The name of the deployment to be created / patchedresourcetemplates:- apiVersion: tekton.dev/v1alpha1kind: PipelineResourcemetadata:name: source-repo-$(params.gitrepositoryname)-$(uid)namespace: $(params.namespace)spec:type: gitparams:- name: revisionvalue: $(params.gitrevision)- name: urlvalue: $(params.gitrepositoryurl)- apiVersion: tekton.dev/v1alpha1kind: PipelineRunmetadata:name: teokton-build-$(params.gitrepositoryname)-$(uid)namespace: $(params.namespace)spec:pipelineRef:name: build-and-deploy-pipelineserviceAccountName: pipeline-accountresources:- name: git-sourceresourceRef:name: source-repo-$(params.gitrepositoryname)-$(uid)params:- name: pathToContextvalue: ""- name: pathToDockerFilevalue: Dockerfile- name: pathToYamlFilevalue: knative.yaml- name: imageUrlvalue: docker.io/vtemian/$(params.gitrepositoryname)- name: imageTagvalue: latest
我们的 TriggerBinding 也将非常简单。只是将 Github 的 payload 映射到 TriggerTemplate。
复制代码
apiVersion: triggers.tekton.dev/v1alpha1kind: TriggerBindingmetadata:name: tekton-pipelinebindingspec:params:- name: gitrevisionvalue: $(body.head_commit.id)- name: namespacevalue: default- name: gitrepositoryurlvalue: $(body.repository.url)- name: gitrepositorynamevalue: $(body.repository.name)
最后,我们需要 EventListener,与 TemplateTrigger 进行绑定
复制代码
apiVersion: triggers.tekton.dev/v1alpha1kind: EventListenermetadata:name: el-tekton-listenerspec:serviceAccountName: tekton-triggers-satriggers:- bindings:- name: tekton-pipelinebindingtemplate:name: tekton-triggertemplate
复制代码
╰─>$ kubectl get service | grep tekel-tekton-listener ClusterIP 10.233.47.3 <none> 8080/TCP 114m
现在服务启动了,我们只需要使用 Istio 公开它。让我们使用一个单独的服务帐户来使用 Tekton 工具:
复制代码
kind: RoleapiVersion: rbac.authorization.k8s.io/v1metadata:name: tekton-triggers-createwebhookrules:- apiGroups:- ""resources:- secretsverbs:- get- list- create- update- delete- apiGroups:- tekton.devresources:- eventlistenersverbs:- get- list- create- update- delete- apiGroups:- extensionsresources:- ingressesverbs:- create- get- list- delete- update---apiVersion: v1kind: ServiceAccountmetadata:name: tekton-triggers-createwebhook---apiVersion: rbac.authorization.k8s.io/v1kind: RoleBindingmetadata:name: tekton-triggers-createwebhooksubjects:- kind: ServiceAccountname: tekton-triggers-createwebhookroleRef:apiGroup: rbac.authorization.k8s.iokind: Rolename: tekton-triggers-createwebhook⏎
跟随任务本身:
复制代码
apiVersion: tekton.dev/v1beta1kind: Taskspec:params:- description: The external domain for the EventListenername: ExternalDomaintype: string- description: The name of the Service used in the VirtualServicename: Servicetype: string- description: The service port that the VirtualService is being created onname: ServicePorttype: stringsteps:- args:- -ce- |set -excat << EOF | kubectl create -f -apiVersion: networking.istio.io/v1alpha3kind: Gatewaymetadata:name: $(inputs.params.Service)-gatewayspec:selector:istio: ingressgatewayservers:- port:number: 80name: http-$(inputs.params.Service)protocol: HTTPhosts:- $(inputs.params.ExternalDomain)---apiVersion: networking.istio.io/v1alpha3kind: VirtualServicemetadata:name: $(inputs.params.Service)-virtual-servicespec:hosts:- $(inputs.params.ExternalDomain)gateways:- $(inputs.params.Service)-gatewayhttp:- route:- destination:host: $(inputs.params.Service)port:number: $(inputs.params.ServicePort)EOFcommand:- shimage: lachlanevenson/k8s-kubectl:latestname: create-istio-gateway-virtualserviceresources: {}volumes:- emptyDir: {}name: work最后是初始化:
复制代码
apiVersion: tekton.dev/v1beta1kind: TaskRunmetadata:spec:params:- name: ExternalDomainvalue: simple-django-app-event-listner.default.147.75.80.160.xip.io- name: Servicevalue: el-tekton-listener- name: ServicePortvalue: "8080"serviceAccountName: tekton-triggers-createwebhooktaskRef:kind: Taskname: create-istio-gateway-virtualservicetimeout: 1h0m0s
然后检查结果:
复制代码
╰─>$ kubectl get VirtualServiceNAME GATEWAYS HOSTS AGEel-tekton-listener-virtual-service [el-tekton-listener-gateway] [simple-django-app-event-listner.default.147.75.80.160.xip.io]
现在我们已经在集群中启动并运行了工具,我们可以创建 webhook。 为此,我们需要一 Github token:
复制代码
apiVersion: v1kind: Secretmetadata:name: webhook-secretstringData:#https://help.github.com/en/github/authenticating-to-github/creating-a-personal-access-token-for-the-command-line#creating-a-tokentoken: <token>secret: random-string-data
下面的 task 将会创建 webhook
复制代码
apiVersion: tekton.dev/vlalpha1kind: Taskmetadata:name: create-webhookspec:volumes:- name: github-secretsecret:secretName: $(inputs.params.GitHubSecretName)inputs:params:- name: ExternalDomaindescription: "The external domain for the EventListener e.g. `$(inputs.params.EventListenerName).<PROXYIP>.nip.io`"- name: GitHubUserdescription: "The GitHub user"- name: GitHubRepodescription: "The GitHub repo where the webhook will be created"- name: GitHubOrgdescription: "The GitHub organization where the webhook will be created"- name: GitHubSecretNamedescription: "The Secret name for GitHub access token. This is always mounted and must exist"- name: GitHubAccessTokenKeydescription: "The GitHub access token key name"- name: GitHubSecretStringKeydescription: "The GitHub secret string key name"- name: GitHubDomaindescription: "The GitHub domain. Override for GitHub Enterprise"default: "github.com"- name: WebhookEventsdescription: "List of events the webhook will send notifications for"default: '[\"push\",\"pull_request\"]'steps:- name: create-webhookimage: pstauffer/curl:latestvolumeMounts:- name: github-secretmountPath: /var/secretcommand:- shargs:- -ce- |set -eecho "Create Webhook"if [ $(inputs.params.GitHubDomain) = "github.com" ];thencurl -v -d "{\"name\": \"web\",\"active\": true,\"events\": $(inputs.params.WebhookEvents),\"config\": {\"url\": \"$(inputs.params.ExternalDomain)\",\"content_type\": \"json\",\"insecure_ssl\": \"1\" ,\"secret\": \"$(cat /var/secret/$(inputs.params.GitHubSecretStringKey))\"}}" -X POST -u $(inputs.params.GitHubUser):$(cat /var/secret/$(inputs.params.GitHubAccessTokenKey)) -L https://api.github.com/repos/$(inputs.params.GitHubOrg)/$(inputs.params.GitHubRepo)/hookselsecurl -d "{\"name\": \"web\",\"active\": true,\"events\": $(inputs.params.WebhookEvents),\"config\": {\"url\": \"$(inputs.params.ExternalDomain)/\",\"content_type\": \"json\",\"insecure_ssl\": \"1\" ,\"secret\": \"$(cat /var/secret/$(inputs.params.GitHubSecretStringKey))\"}}" -X POST -u $(inputs.params.GitHubUser):$(cat /var/secret/$(inputs.params.GitHubAccessTokenKey)) -L https://$(inputs.params.GitHubDomain)/api/v3/repos/$(inputs.params.GitHubOrg)/$(inputs.params.GitHubRepo)/hooksfi并进行初始化
复制代码
apiVersion: tekton.dev/v1alpha1kind: TaskRunmetadata:name: create-api-repo-webhook-runspec:taskRef:name: create-webhookinputs:params:- name: GitHubOrgvalue: "vtemian"- name: GitHubUservalue: "vtemian"- name: GitHubRepovalue: "simple-django-app"- name: GitHubSecretNamevalue: webhook-secret- name: GitHubAccessTokenKeyvalue: token- name: GitHubSecretStringKeyvalue: secret- name: ExternalDomainvalue: http://simple-django-app-event-listner.default.147.75.80.160.xip.iotimeout: 1000sserviceAccountName: tekton-triggers-createwebhook
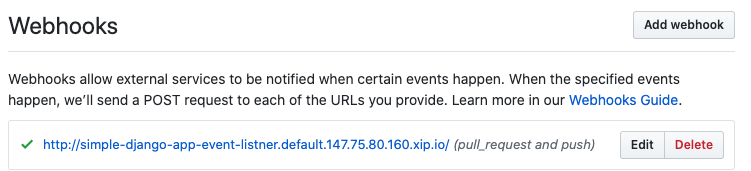
现在,每次我们进行新更改时,都会触发一个新构建:
复制代码
╰─>$ kubectl get po | grep teoteokton-build-simple-django-app-2fcdr-source-to-image-v86-mwxhw 0/3 Error 0 71mteokton-build-simple-django-app-qlw5w-source-to-image-sz2-gpqdm 0/3 Error 0 73mteokton-build-simple-django-app-sl9zf-source-to-image-knl-tzxpk 1/3 Running 0 18steokton-build-simple-django-app-xh54x-deploy-to-cluster-b-5p7r4 0/3 Completed 0 66mteokton-build-simple-django-app-xh54x-source-to-image-wv5-9bsdt 0/3 Completed 0 66m
并且部署应用程序
复制代码
╰─>$ kubectl get po | grep simplesimple-django-app-cjx8b-deployment-7cd5c5999d-vwjhv 2/2 Running 0 4h3msimple-django-app-d2n6n-deployment-77c664bf4f-pz6hg 2/2 Running 0 4h29msimple-django-app-hcmpl-deployment-7687b96b5f-pv2wz 2/2 Running 0 67m
Conclusions
总结一下,我们设法配置了裸机基础架构,安装了 Knative,并拥有了一个通过 git push 代码来构建和部署我们应用程序新版本的 CI/CD。这些看起来有些麻烦,所以我们留下了一些有关修订、路由和蓝绿部署的细节。
从工程角度来看, Vercel , Heroku , Google Cloud Run 和 AWS ECS 之类的平台确实非常出色,因为它们减轻了部署应用程序和管理基础架构的负担。感谢 Knative 和 Tekton,它降低了我们使用此类平台的门槛。
英文原文:
Building a serverless hosting platform