Linux 操作系统,相信大家都不陌生了,那么我们在 Linux 系统中的两个查看进程的命令也用的不计其数,ps命令用于显示当前进程 process 的状态、top命令用于实时显示 process 的动态。
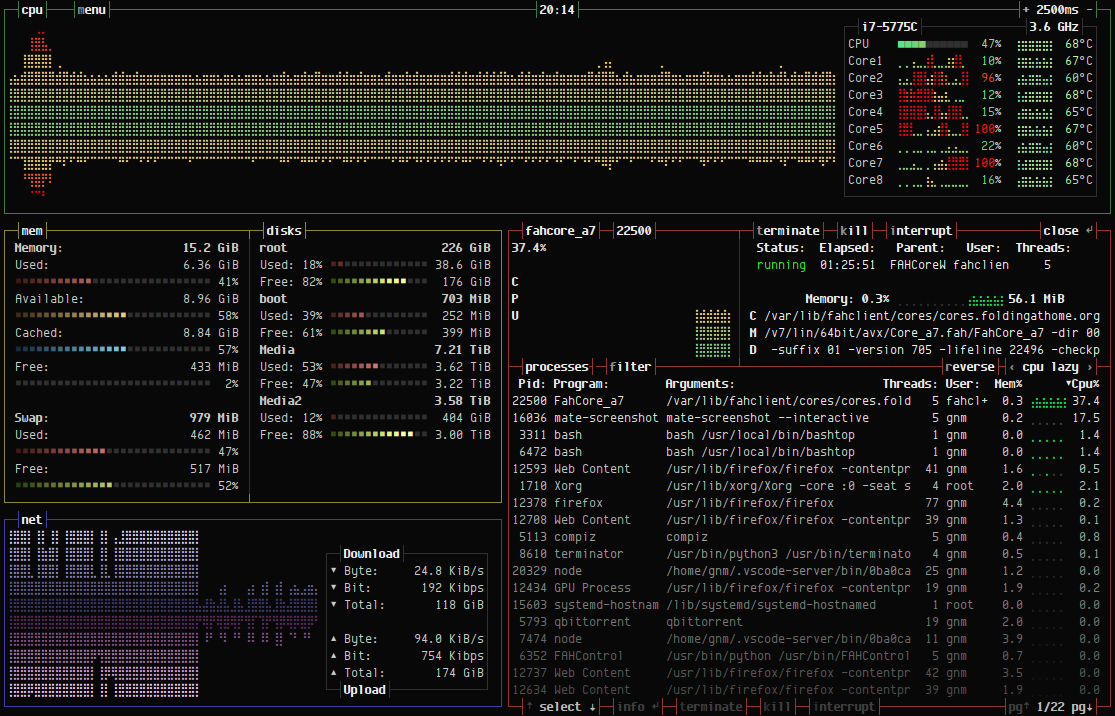
那么,今天给大家推荐一款 GitHub 热榜的 Linux 资源监视器:bashtop,其主要作用:用于展示当前 Linux 操作系统的显示处理器、内存、硬盘、网络和进程等各项资源的使用情况与状态。
该工具是由瑞典的一名开发者 aristocratos 开发而成,现累积近 4000+ Star。
首先我们先来看看bashtop资源监视器主界面,看似很高大上吧。
特征:
易使用,快速响应的操作界面,可进行过程选择;
用于显示所选进程的详细统计信息的功能;
将 SIGTERM,SIGKILL,SIGINT 发送到选定的进程;
能够过滤流程;
排序选项之间可轻松切换;
网络使用情况的自动缩放图;
支持多个不同主题风格的配置;
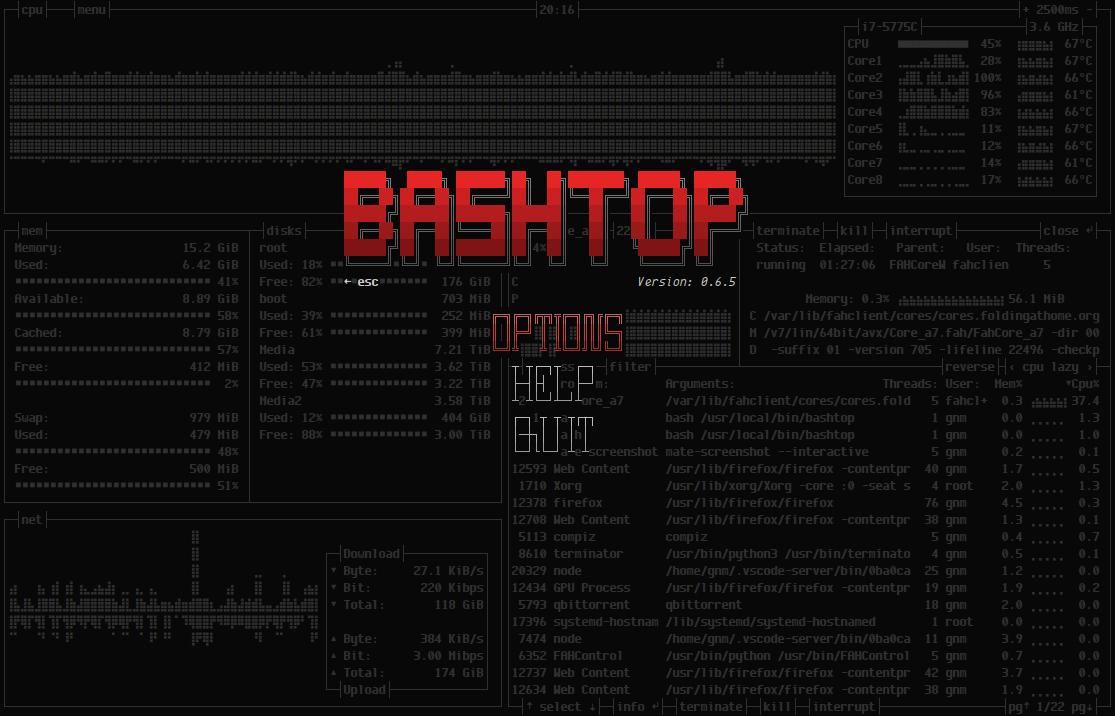
可根据自己的需求修改及设置 Main 配色,在自定义设置主题时,重新生成一个名为.theme的主题文件并设置默认变量赋值。
#Bashtop theme with flat-remix colors......# Main background, empty for terminal default, need to be empty if you want transparent backgroundtheme[main_bg]=""# Main text colortheme[main_fg]="#737680"# Title color for boxestheme[title]="#272a34"# Higlight color for keyboard shortcutstheme[hi_fg]="#90"# Background color of selected item in processes boxtheme[selected_bg]="#b8174c"# Foreground color of selected item in processes boxtheme[selected_fg]="#ff"# Color of inactive/disabled texttheme[inactive_fg]="#40"# Misc colors for processes box including mini cpu graphs, details memory graph and details status texttheme[proc_misc]="#367bf0"# Cpu box outline colortheme[cpu_box]="#367bf0"# Memory/disks box outline colortheme[mem_box]="#19a187"# Net up/down box outline colortheme[net_box]="#fd3535"# Processes box outline colortheme[proc_box]="#4aaee6"# Box divider line and small boxes line colortheme[div_line]="#50"# Temperature graph colorstheme[temp_start]="#367bf0"theme[temp_mid]="#b8174c"theme[temp_end]="#d41919"# CPU graph colorstheme[cpu_start]="#367bf0"theme[cpu_mid]="#4aaee6"theme[cpu_end]="#54bd8e"# Mem/Disk free metertheme[free_start]="#811035"theme[free_mid]="#b8174c"theme[free_end]="#d41919"# Mem/Disk cached metertheme[cached_start]="#2656a8"theme[cached_mid]="#4aaee6"theme[cached_end]="#23bac2"# Mem/Disk available metertheme[available_start]="#fea44c"theme[available_mid]="#fd7d00"theme[available_end]="#fe7171"# Mem/Disk used metertheme[used_start]="#12715f"theme[used_mid]="#19a187"theme[used_end]="#23bac2"# Download graph colorstheme[download_start]="#367bf0"theme[download_mid]="#19a187"theme[download_end]="#4aaee6"# Upload graph colorstheme[upload_start]="#8c42ab"theme[upload_mid]="#b8174c"theme[upload_end]="#d41919"
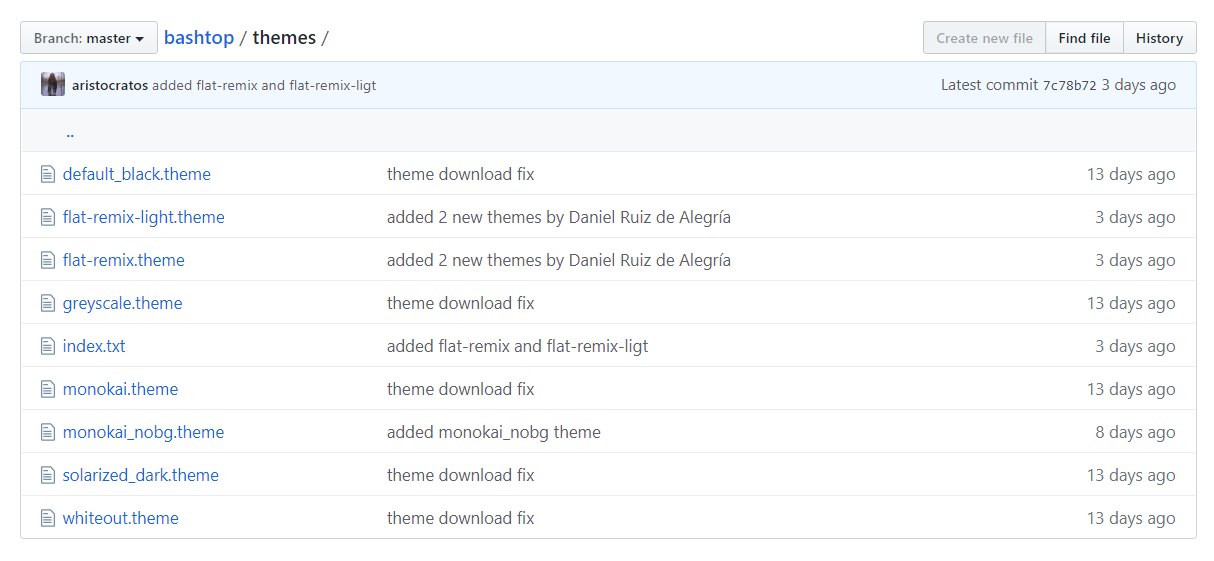
更多的主题配色,可通过bashtop项目中的themes文件夹查看。
手动安装
下载bashtop到PATH中,从克隆目录中运行。
Debian 快速安装
$ sudo ./build
卸载
$ sudo ./build --remove
由此看来目前bashtop还处于开发阶段,接下来,还有很多要去做新功能:
添加选项以及更改文本,图形和仪表的颜色。
添加并支持显示 AMD CPU 温度;
显示进程的树状视图;
重置网络下载/上传总数;
添加 gpu temp 的用法;
磁盘 io 统计信息;
调整所有框大小的选项;
添加命令行参数解析;
其他优化和代码清除;
稀疏之处添加评论;
修复跨平台的可兼容性;
GitHub 地址:https://github.com/aristocratos/bashtop
总结:
看下来,这个工具还不是很完善,期待后续的功能更新,也希望大家能够结合该工具并运用到实际环境中,给你不一般的资源监视器。